Sugar (SUGAR) is down 2.27% at Aug 24 03:50(ET), now at $0.1767, with a 7-day up of 2.02%.
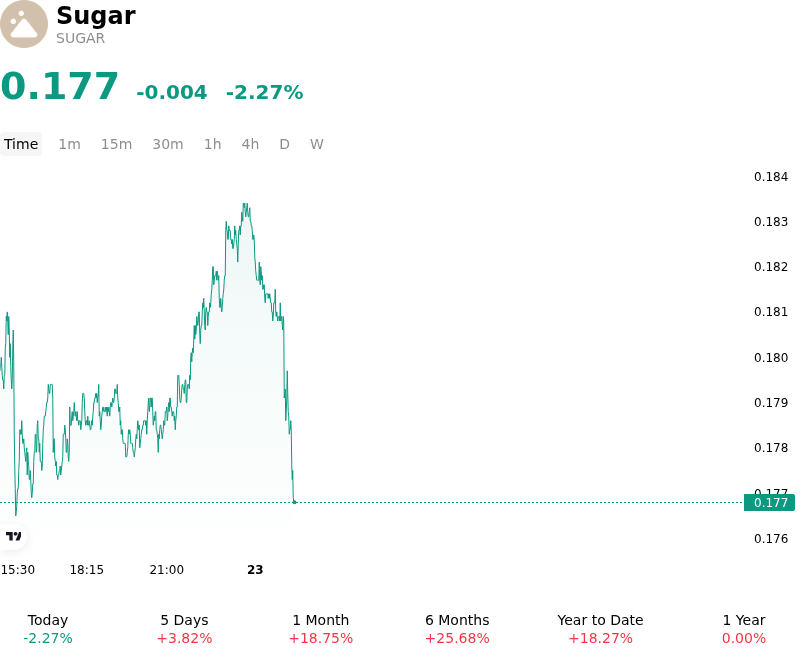
What is driving Sugar (SUGAR)’s stock price down today?
The downside movement in raw sugar futures was primarily driven by long liquidation and profit-taking following a sharp multi-week rally that had pushed global prices to multi-month highs. After futures approached key psychological resistance levels, institutional investors and speculative funds moved to de-risk and lock in gains. The profit-taking was accelerated as the initial wave of buying, triggered by recent global supply announcements, reached technical exhaustion, prompting a temporary consolidation in positioning.
A key catalyst easing immediate upside pressure was the aggressive implementation of supply-control measures and anti-hoarding policies in India. To rein in domestic price inflation ahead of peak festive demand, Indian authorities imposed strict inventory holding limits on bulk industrial buyers and traders, initiated physical mill stock audits, and authorized duty-free raw sugar imports. Expectations that import shipments from Brazil would soon arrive to reinforce destination inventory buffers helped cap immediate spot market tightness, muting short-term speculative demand across international benchmark contracts.
Despite the session's pullback, broader supply-demand fundamentals remain tight, suggesting the decline reflects an event-driven technical correction rather than a fundamental trend reversal. Global balance sheets remain constrained by lower overall output projections in Brazil’s Center-South region, where mills continue allocating significant cane volume toward ethanol production, alongside lingering weather uncertainties linked to El Niño across key Asian sugar belts. Market participants continue to closely monitor Brazilian crushing progress, monsoon performance in India and Thailand, and global trade flows to gauge the stability of medium-term supplies.
Technical Analysis of Sugar (SUGAR)
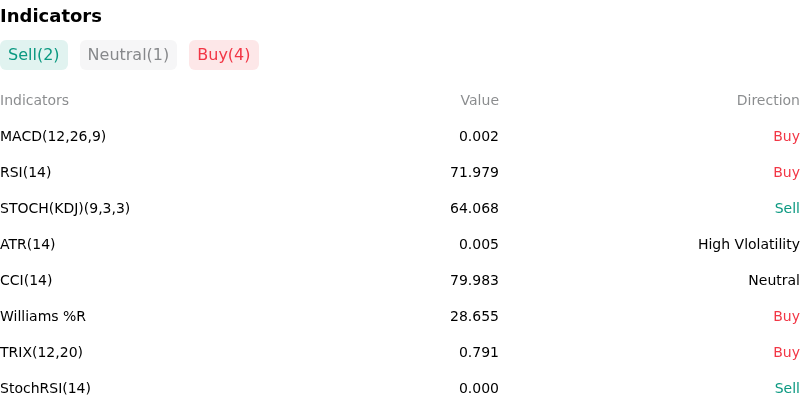
Technically, Sugar (SUGAR) shows a MACD (12,26,9) value of 0.002, indicating a buy signal. The RSI at 71.979 suggests buy condition and the Williams %R at 28.655 suggests buy condition. Please monitor closely.
More details about Sugar (SUGAR)
Recent Events and Risks:
- Surging Brazilian Sugar Allocation Mix: Industry reports from UNICA show Center-South Brazilian mills increasing the proportion of sugarcane allocated to sugar output relative to ethanol, driving higher-than-expected raw sugar processing volumes and pressuring ICE futures.
- Depressed Crude Oil and Ethanol Economics: Recent weakness in global crude oil prices undercuts biofuel margins in Brazil, reducing the financial incentive for mills to crush cane for ethanol and forcing a operational pivot toward sugar production that swells global exportable supplies.
- Improving Indian Monsoon Rains and Policy Shifts: Recovery in cumulative monsoon rainfall across major Indian cane belts alongside reduced domestic sugar-to-ethanol diversion mandates threatens to increase net domestic sugar output and unlock additional export quotas.
- Global Production Surplus and Speculative Liquidation: Forecasts from major agricultural trade groups pointing to a sustained global sugar production surplus, combined with expanding speculative short positioning on ICE No. 11 contracts, leave the market vulnerable to continued technical selling and long liquidation.
Find out more