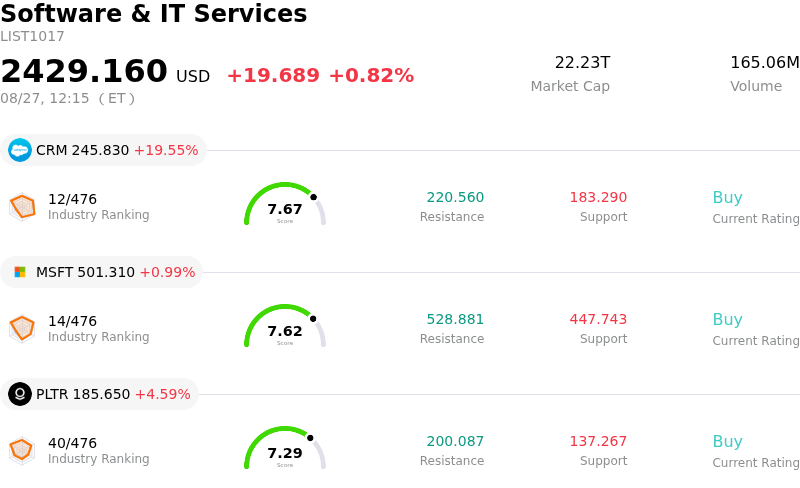
Spotify Technology SA (SPOT) moved down by 4.49%. The Software & IT Services sector is up by 0.82%. The company underperformed the industry. Top 3 stocks by turnover in the sector: Salesforce Inc (CRM) up 19.55%; Microsoft Corp (MSFT) up 0.99%; Palantir Technologies Inc (PLTR) up 4.59%.
What is driving Spotify Technology SA (SPOT)’s stock price down today?
Spotify Technology experienced noticeable downward pressure and elevated intraday volatility during today's trading session, driven primarily by profit-taking following a multi-week rally and lingering valuation concerns. The stock had recently built momentum after management announced a substantial expansion of its share repurchase program, boosting capital return expectations. However, as shares approached near-term technical resistance levels, institutional traders and short-term investors moved to lock in gains, triggering a sharp session pullback.
Underlying the retreat is ongoing market digestion of the company's second-quarter financial performance. Although Spotify continues to expand its premium subscriber base and demonstrate structural margin discipline, its recent earnings release revealed modest revenue and earnings shortfalls relative to elevated Wall Street forecasts. Market participants remain focused on gross margin durability, the monetization pace of new AI-driven product capabilities, and ongoing content licensing costs. With valuation metrics trading at a premium compared to traditional media peers, the equity remains sensitive to broader market re-evaluations.
Broader sector rotation out of high-multiple growth equities also contributed to the day's weakness. Furthermore, disclosures of routine insider share sales for tax withholding obligations slightly weighed on market sentiment. While the long-term fundamentals of the company stay anchored by steady active user growth, expansion into video and audiobooks, and strong balance sheet flexibility, current price action underscores a period of technical consolidation as investors weigh near-term execution risks against multi-year growth targets.
Technical Analysis of Spotify Technology SA (SPOT)
Technically, Spotify Technology SA (SPOT) shows a MACD (12,26,9) value of 5.788, indicating a buy signal. The RSI at 54.750 suggests neutral condition and the Williams %R at 41.191 suggests buy condition. Please monitor closely.
Fundamental Analysis of Spotify Technology SA (SPOT)
Spotify Technology SA (SPOT) is in the Software & IT Services industry. Its latest annual revenue is $20.44B, ranking 22 in the industry. The net profit is $2.63B, ranking 22 in the industry. Company Profile
Over the past month, multiple analysts have rated the company as Buy, with an average price target of $606.95, a high of $743.55, and a low of $420.00.
More details about Spotify Technology SA (SPOT)
Company Specific Risks:
- Earnings and Top-Line Execution Disappointment: Spotify's Q2 financial reporting showed an earnings miss of $3.03 per share versus the $3.16 consensus estimate, alongside quarterly revenues of $5.45 billion missing expectations of $5.47 billion, signaling operational drag and softer subscriber additions.
- Valuation Multiples and Reinvestment Pressure: With Wall Street firms recently issuing ratings downgrades, analysts warn that Spotify's premium valuation leaves little room for operational error, particularly as escalating AI infrastructure costs and heavy reinvestment needs threaten profit expansion.
- High Licensing Dependence and Royalty Constraints: Spotify remains structurally reliant on major record labels that control roughly 72% of platform streams, capping margin leverage while controversial platform changes such as podcast ad-skipping feature rollouts threaten monetization and creator relationships.
- Technical Resistance and Profit-Taking Volatility: Near-term technical indicators show a bearish short-term MACD crossover and downside momentum as the stock struggles against resistance in the $540–$550 range, spurring intraday volatility and profit-taking.
Find out more