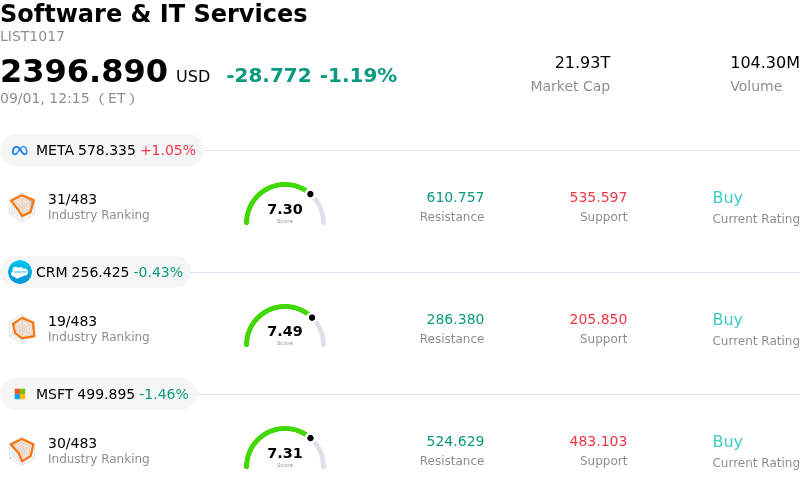
ServiceNow Inc (NOW) moved down by 3.76%. The Software & IT Services sector is down by 1.19%. The company underperformed the industry. Top 3 stocks by turnover in the sector: Meta Platforms Inc (META) up 1.05%; Salesforce Inc (CRM) down 0.43%; Microsoft Corp (MSFT) down 1.46%.
What is driving ServiceNow Inc (NOW)’s stock price down today?
Broad market risk-off sentiment and rising benchmark bond yields created notable pressure on high-multiple technology equities. Benchmark Treasury yields moved higher as investors weighed persistent macroeconomic friction and geopolitical tensions. High-beta enterprise software and cloud infrastructure stocks bore the brunt of this rate pressure, as elevated discount rates compress the current valuation multiples of long-duration growth assets.
Sector-wide profit taking also weighed heavily on the software space following a major multi-week rally. After recovering strongly through late August on robust quarterly enterprise spending reports and fading fears surrounding generative AI disintermediation, software stocks encountered resistance. ServiceNow, which experienced a steep upward run off its early August lows supported by strategic enterprise AI partnerships and favorable analyst price target revisions, proved particularly sensitive to profit taking as traders locked in recent gains.
Company-specific valuation factors further amplified the downside momentum. Despite strong underlying fundamentals, robust subscription growth, and solid recurring revenue metrics, the company continues to trade at a premium valuation multiple relative to broader software sector averages. This elevated valuation leaves little margin for error during market pullbacks. Additionally, recent insider transaction filings revealing share sales served as a minor dampener on near-term trading sentiment, encouraging institutional investors to adopt a more cautious posture ahead of upcoming economic data releases.
Technical Analysis of ServiceNow Inc (NOW)
Technically, ServiceNow Inc (NOW) shows a MACD (12,26,9) value of 3.141, indicating a buy signal. The RSI at 66.965 suggests neutral condition and the Williams %R at 21.849 suggests buy condition. Please monitor closely.
Media Coverage of ServiceNow Inc (NOW)
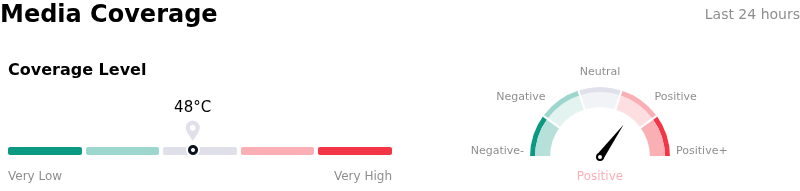
In terms of media coverage, ServiceNow Inc (NOW) shows a coverage score of 48, indicating a moderate level of media attention. The overall market sentiment index is currently in bullish zone.
Fundamental Analysis of ServiceNow Inc (NOW)
ServiceNow Inc (NOW) is in the Software & IT Services industry. Its latest annual revenue is $13.28B, ranking 28 in the industry. The net profit is $1.75B, ranking 30 in the industry. Company Profile
Over the past month, multiple analysts have rated the company as Buy, with an average price target of $145.89, a high of $248.00, and a low of $72.00.
More details about ServiceNow Inc (NOW)
Company Specific Risks:
- Elevated Valuation and Multiple Compression: Trading at a premium valuation exceeding 77x earnings, ServiceNow remains highly susceptible to sharp intraday price-multiple compression and profit-taking during broader enterprise software sector recalibrations.
- Margin Pressure from AI Infrastructure and Amortization: Accelerating investments in generative AI capabilities and inference costs, combined with heavy acquisition-related amortization expenses, have significantly contracted GAAP operating profitability and elevated near-term margin concerns.
- Earnings Revisions and Revenue Pull-Forward Headwinds: Downward revisions to near-term consensus EPS estimates, alongside past revenue pull-forwards from federal contracts and projected foreign exchange drags on calculated remaining performance obligations (cRPO), create operational friction and downside volatility.
- Competitive Threats to Core Workflow Monetization: Intensifying competition from cloud platform hyperscalers and emerging agentic AI tools poses long-term disruption risks to seat-based enterprise SaaS pricing and core workflow market share.
Find out more