TradingKey - On September 3, Eastern Time, SpaceX (SPCX) shares briefly touched near recent highs in early trading, rising over 5%.
According to reports, Oppenheimer analyst Timothy Horan said SpaceX is expected to emerge as a winner amid the short-term compute shortage. He raised the price target from $250 to $280 and assigned a "Buy" rating to SpaceX.
Horan believes the company "has the ability to bring online infrastructure faster than anyone else, and is leveraging this infrastructure and its data to refine its models faster than anyone else."
Horan stated: "In an environment where compute remains constrained, we expect SpaceX to capture half of every dollar of revenue generated by partners like Anthropic using SpaceX's compute."
In addition to selling compute, SpaceX is also leveraging its resources to train its own frontier model, Grok. SpaceX also recently completed its acquisition of AI startup Cursor, a move Horan called "transformative" that will help SpaceX develop its models and generate additional revenue.
Shortly after Anthropic released its latest AI model, Musk said SpaceX would launch its newest model, Grok 4.7, within 10 days. Data from Artificial Analysis shows that SpaceX's Grok 4.6, released less than a month ago, delivers powerful capabilities at a lower cost than some leading models.
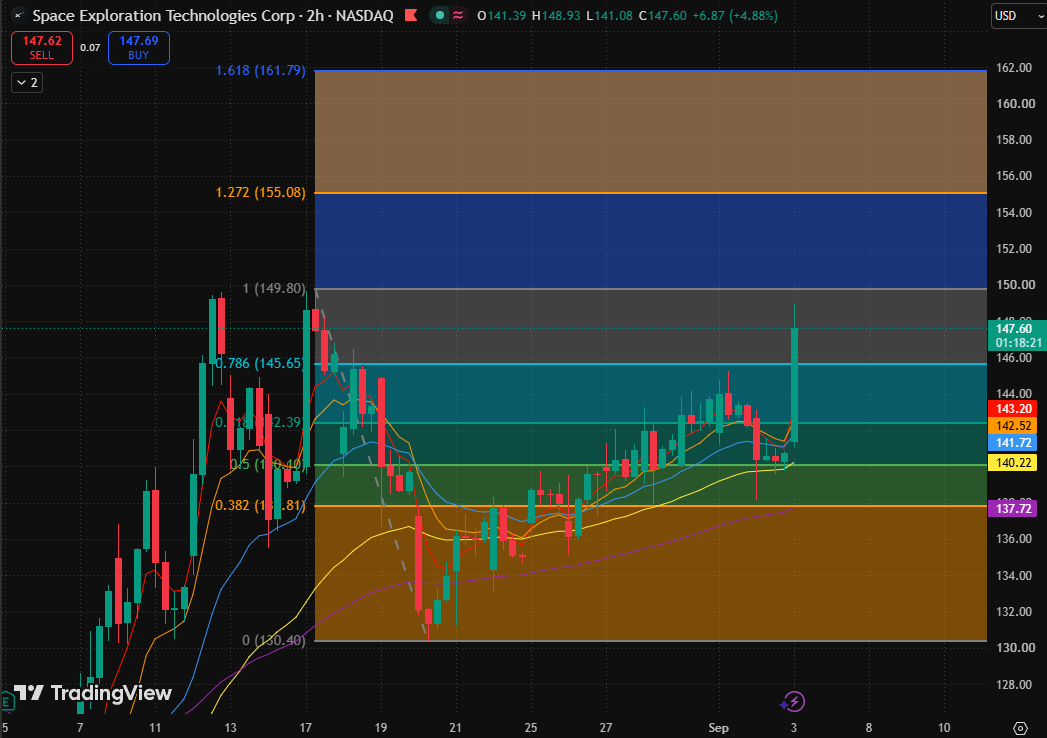
SpaceX 2-hour stock chart, Source: TradingView
Looking at the SpaceX stock chart, after halting its decline around $130.40, the price sequentially reclaimed the 0.382 Fibonacci retracement level ($137.81), the 0.5 Fibonacci retracement level ($140.10), and the 0.618 Fibonacci retracement level ($142.39). A recent pullback held above support near the 80-day moving average, followed by a strong bullish candlestick break above $145.65, indicating that short-term buyers have regained dominance.
Regarding moving averages, the price is above all five moving averages, with the 5-day moving average ($143.20) sitting above the 10-day moving average ($142.52) and the 20-day moving average ($141.71), reflecting a significant improvement in the short-term moving average structure. The 80-day moving average ($140.22) and the 160-day moving average ($137.72) are located below the price, providing medium-to-short-term support for this rebound.
However, whether the breakout is valid still depends on whether subsequent 2-hour candlesticks can close firmly above the 0.786 Fibonacci retracement level ($145.65) and further break through the previous high of $149.80. If $149.80 is effectively reclaimed, the upside targets for the rebound can be eyed at the 1.272 Fibonacci extension level ($155.08) and the 1.618 Fibonacci extension level ($161.79) in turn.
Conversely, if the price pulls back below $145.65 after surging, this sharp bullish candlestick is more likely to be defined as a test of overhead resistance, and the stock will still need to digest gains within the $142.39–$145.65 range in the short term.
Find out more