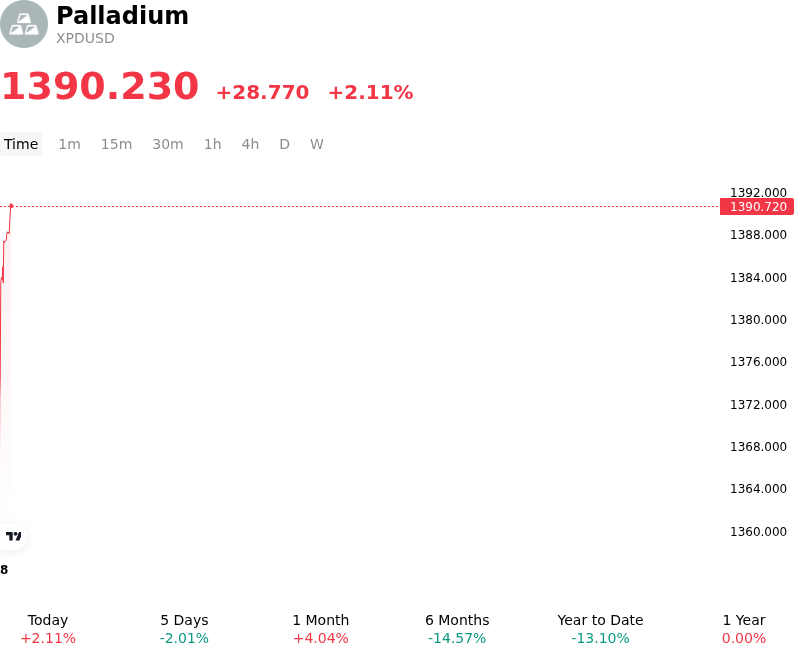
Palladium (XPDUSD) is up 2.11% at Sep 6 18:25(ET), now at $1390.23, with a 7-day down of 2.01%.
What is driving Palladium (XPDUSD)’s stock price up today?
The advance in spot palladium was primarily driven by a dovish recalibration of Federal Reserve monetary policy expectations, which triggered a pullback in the US dollar index and a decline in real Treasury yields. Easing real yields reduced the opportunity cost of holding non-yielding precious and industrial metals, sparking broad-based buying and short-covering across dollar-denominated commodity contracts. Broader strength across the precious metals complex further bolstered investor sentiment, encouraging institutional capital reallocations into platinum group metals.
On the supply side, persistent constraints in primary mine output continue to provide underlying structural support. Reduced production expectations from major producing regions, notably Russia and South Africa, have reinforced market tight-balance projections. Anticipated output declines from key primary producers have kept global mine supply constrained, prompting industrial end-users and institutional funds to secure physical spot coverage ahead of potential market deficit conditions.
Demand expectations were further stabilized by steady industrial consumption from the global automotive sector. While long-term material substitution toward lower-cost platinum and the gradual transition to electric vehicles remain structural headwinds, resilient market share for hybrid vehicles—which utilize significant palladium loadings in exhaust catalytic converters—has sustained underlying physical offtake. This steady industrial demand, combined with selective inventory restocking following prior pullbacks, provided firm support for spot prices.
Market structure and liquidity conditions also played a key role in magnifying the upward momentum. Futures contracts for palladium continue to trade with relatively thin order-book depth and concentrated positioning, making intraday price action sensitive to systematic buying signals and forced position adjustments. Going forward, market participants will maintain focus on central bank rate policy signals, global manufacturing activity, and secondary scrap recovery trends to evaluate the sustainability of current price levels.
Technical Analysis of Palladium (XPDUSD)
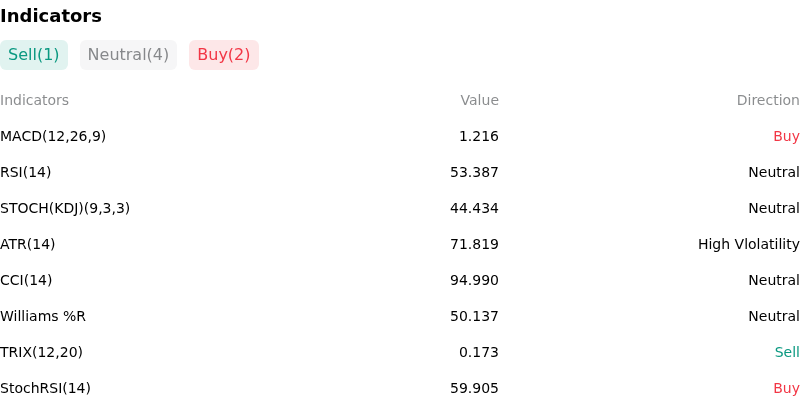
Technically, Palladium (XPDUSD) shows a MACD (12,26,9) value of 1.216, indicating a buy signal. The RSI at 53.387 suggests neutral condition and the Williams %R at 50.137 suggests neutral condition. Please monitor closely.
More details about Palladium (XPDUSD)
Recent Events and Risks:
- Accelerating EV Adoption and Auto Demand Loss: Rapid electrification in key passenger vehicle markets, highlighted by Chinese battery electric vehicle output outpacing traditional internal combustion engine car production, is significantly eroding global autocatalyst consumption, which accounts for nearly 80% of total palladium demand.
- Industrial Substitution Toward Platinum: Automakers continue to aggressively adjust catalytic converter formulations to replace palladium with lower-cost platinum, resulting in hundreds of thousands of ounces of annualized demand displacement that directly caps palladium upside and expands downside spot risks.
- U.S. Dollar Firmness and Macro Risk-Off Flows: A strong U.S. Dollar Index alongside elevated Treasury yields and persistent hawkish interest rate expectations continue to weigh on non-yielding precious and industrial commodities, driving speculative liquidations and intraday selling pressure in XPDUSD.
- Rising Secondary Recycling Supply and Oversupply Outlook: Increased scrap recovery from decommissioned vehicles combined with institutional refiner forecasts pointing toward a structural oversupply environment is putting downward pressure on futures curves and exacerbating spot market volatility.
Find out more