USD/JPY (USDJPY) is up 0.51% at Sep 10 08:30(ET), now at $154.308, with a 7-day down of 0.95%.
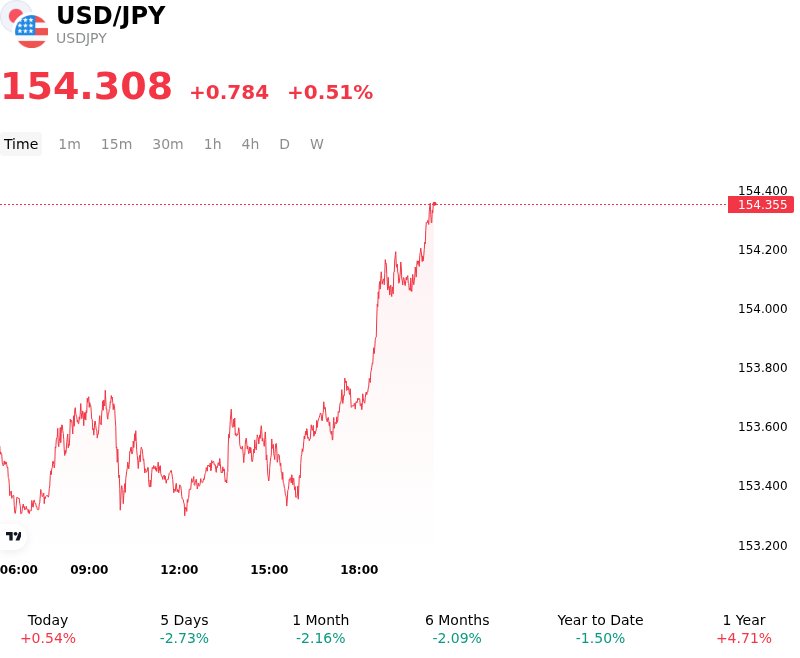
What is driving USD/JPY (USDJPY)’s stock price up today?
The advance in USDJPY during the session was primarily driven by technical short-covering and position recalibration following several consecutive days of heavy downside pressure that pushed the currency pair into deeply oversold territory. As market participants adjusted exposure ahead of crucial U.S. inflation data and upcoming central bank policy meetings, the U.S. dollar gained traction from stabilizing U.S. Treasury yields. The unwinding of stretched short-dollar hedges provided an immediate floor for the pair, triggering systematic buy-stops and driving a counter-trend bounce across global trading sessions.
From a fundamental standpoint, divergent commodity and yield dynamics added downward pressure on the Japanese yen relative to the U.S. dollar. A sharp escalation in crude oil prices toward multi-week highs weighed on Japan’s terms of trade, as higher energy import costs undermine the nation's trade balance and erode real economic income. At the same time, U.S. bond yields consolidated as market participants demanded a risk premium ahead of key macroeconomic releases. Although market pricing continues to reflect hawkish expectations for Bank of Japan policy normalization, the surge in global energy costs temporarily outweighed monetary policy convergence narratives.
Institutional investors view the session's move as a tactical, event-driven correction rather than the start of a broader bullish trend reversal for USDJPY. The bounce reflects short-term positioning adjustments and oversold technical relief in an environment dominated by pre-data caution. Key risks monitored by foreign exchange strategists remain focused on upcoming U.S. inflation prints, the trajectory of benchmark U.S. yields, and official Bank of Japan forward guidance ahead of scheduled policy decisions.
Technical Analysis of USD/JPY (USDJPY)
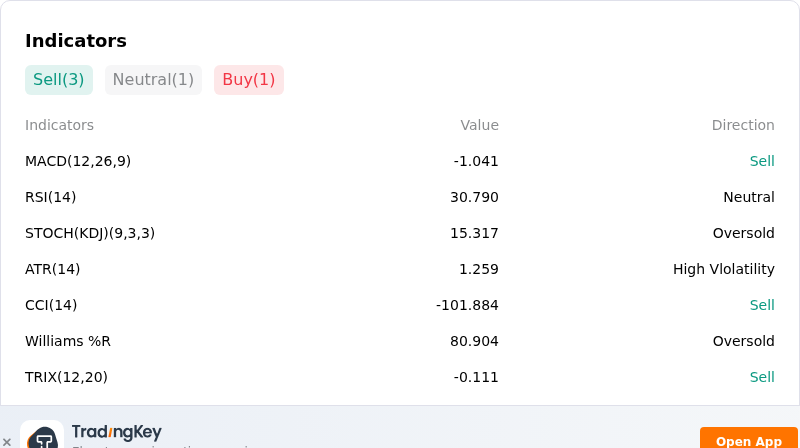
Technically, USD/JPY (USDJPY) shows a MACD (12,26,9) value of -1.041, indicating a sell signal. The RSI at 30.790 suggests neutral condition and the Williams %R at 80.904 suggests oversold condition. Please monitor closely.
More details about USD/JPY (USDJPY)
Recent Events and Risks:
- Bank of Japan Hawkish Repricing: Aggressive market pricing for a 25 basis point rate hike at the upcoming Bank of Japan monetary policy meeting, reinforced by hawkish commentary from BoJ board members and strong wage growth, continues to narrow U.S.-Japan yield differentials and exert heavy downward pressure on USD/JPY.
- Official FX Intervention Threats: Elevated verbal warnings from monetary authorities and official support for yen-stabilization efforts have heightened fears of direct currency intervention, forcing speculative long-dollar traders to liquidate positions.
- U.S. Inflation Data Sensitivity: Imminent releases of U.S. Producer Price Index (PPI) and Consumer Price Index (CPI) metrics present severe downside risk, as any cooler-than-expected inflation print risks dragging U.S. Treasury yields lower and triggering sharp downside volatility in the pair.
- Yen Carry Trade Unwinding and Technical Breaks: USD/JPY's technical breakdown below key medium-term support levels near 155.00 and 153.00 has exacerbated intraday selling pressure, accelerating systematic stop-loss execution and the unwinding of leveraged yen carry trade positioning.
Find out more