TradingKey - At the close on September 18 US Eastern Time, Micron Technology (MU) stock rose 3.92% to close at $1,015.80, after touching an intraday high of $1,016.44; this followed a 5.50% surge on September 17. The two-day cumulative gain approached 10%, reclaiming the round-number threshold of $1,000. Compared with the low of $902.60 on September 14, the share price has rebounded by over 12%.
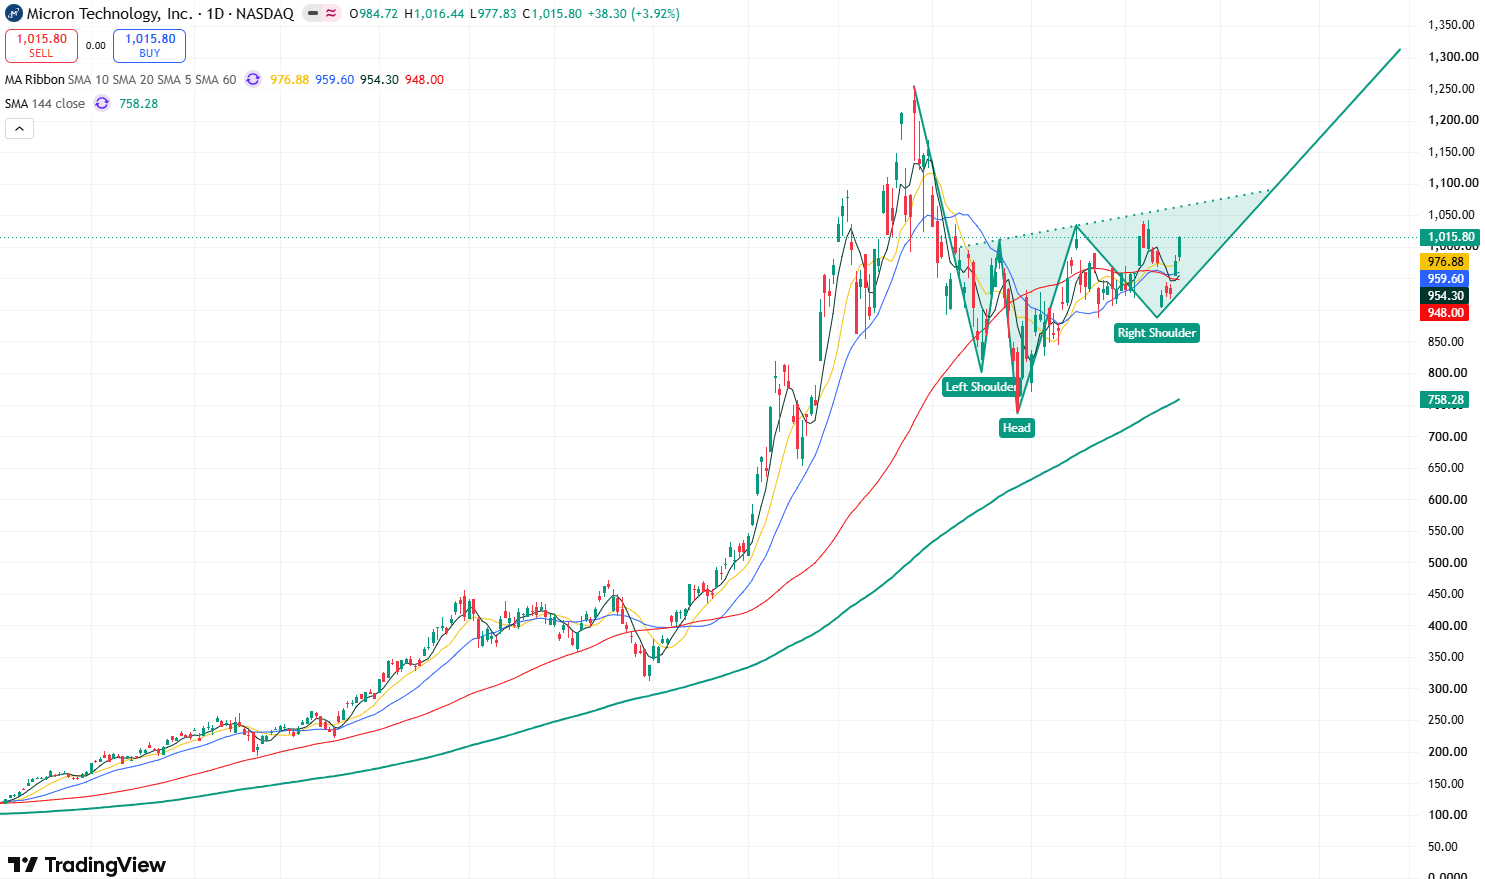
Daily chart of Micron stock price, Source: TradingView
Judging from the daily chart of Micron's stock price, the stock rebounded and reclaimed $1,000, while approaching the phase high of $1,042.40 set on September 9. Trading volume reached approximately 34.6 million shares on September 18, significantly higher than the recent average of about 24.8 million shares, indicating that this rally was supported by clear capital inflows.
Meanwhile, the candlestick structure of Micron's stock price has formed a clear inverse head-and-shoulders pattern. The stock experienced two consecutive downward pullbacks recently, neither of which broke below the left shoulder of $804, and the candlestick lows are gradually rising, indicating that market bullish momentum is steadily strengthening.
In terms of technical indicators, the recent 14-day RSI is around 58, placing it in a neutral-to-bullish zone, while the MACD remains positive, suggesting no obvious overbought signal at present and indicating room for further technical upside.
Currently, the primary resistance level to watch above is the September 8 high of $1,041. If the share price can break out above this level on high volume and hold firm, it will open up room for gains toward the all-time high of $1,255, with the potential to further set new record highs.
On the downside, the primary support level to watch below is around $888–$900. If the stock falls below $888, it may further drop toward $804; if this level fails to hold, the stock may test lower into the $740–$760 range.
Find out more