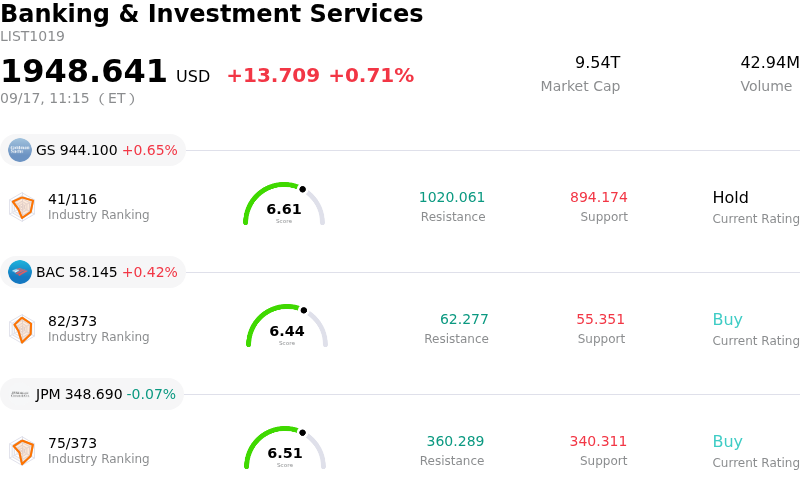
Banco Santander SA (SAN) moved up by 3.09%. The Banking & Investment Services sector is up by 0.71%. The company outperformed the industry. Top 3 stocks by turnover in the sector: Goldman Sachs Group Inc (GS) up 0.65%; $Bank of America Corp(BAC-N)$ (BAC) up 0.42%; JPMorgan Chase & Co (JPM) down 0.07%.
What is driving Banco Santander SA (SAN)’s stock price up today?
Banco Santander experienced upward price movement accompanied by notable intraday volatility, primarily driven by strong investor interest following updated regulatory disclosures regarding its ongoing capital return strategy. The bank confirmed significant progress on its share repurchase program, disclosing the acquisition of over seven million shares in mid-September. Reaching nearly one-third of its total authorized buyback cap, this repurchase initiative reinforces management's commitment to returning capital to shareholders, reducing total outstanding share count, and enhancing earnings per share. The systematic bid provided by corporate repurchases helped anchor buyer confidence during market swings.
Underpinning the stock's performance were strategic moves to strengthen institutional banking capabilities and favorable financial sector dynamics. Santander announced key leadership appointments within its Corporate and Investment Banking division to establish a dedicated commodities trading oversight framework, marking a broader expansion into metals and commodity derivatives. Investors reacted constructively to this initiative aimed at diversifying fee revenue streams alongside the bank's resilient net interest margins. Robust core capital buffers and solid underlying operational efficiency continue to support medium-term growth expectations across its European and international franchises.
Despite the positive trajectory, trading exhibited heightened volatility throughout the session as market participants balanced capital return tailwinds against broader macroeconomic factors. Technical profit-taking near recent high trading ranges briefly created selling pressure, while changing monetary policy expectations contributed to financial sector chop. However, persistent corporate buying, favorable valuation metrics, and solid institutional demand ultimately absorbed short-term supply, allowing the stock to finish the session firmly in positive territory.
Technical Analysis of Banco Santander SA (SAN)
Technically, Banco Santander SA (SAN) shows a MACD (12,26,9) value of -0.072, indicating a neutral signal. The RSI at 55.136 suggests neutral condition and the Williams %R at 27.333 suggests buy condition. Please monitor closely.
Fundamental Analysis of Banco Santander SA (SAN)
Banco Santander SA (SAN) is in the Banking & Investment Services industry. Its latest annual revenue is $65.95B, ranking 5 in the industry. The net profit is $15.90B, ranking 5 in the industry. Company Profile
Over the past month, multiple analysts have rated the company as Buy, with an average price target of $14.71, a high of $15.60, and a low of $13.82.
More details about Banco Santander SA (SAN)
Company Specific Risks:
- Analyst Forecast Reductions and Earnings Misses: Institutional researchers at Erste Group Bank recently trimmed FY2026 EPS forecasts to $1.19, below the consensus estimate of $1.25, following a quarterly earnings miss where reported EPS of $0.27 fell short of the $0.29 Wall Street estimate.
- Elevated Macro Sensitivity and Benchmark Yield Volatility: Possessing a high beta of 1.84 and elevated short-term realized volatility, the equity remains acutely exposed to global macro headwinds, including surging benchmark Treasury yields and restrictive central bank rate expectations pressuring bank valuations.
- M&A Integration and Loan Portfolio Risk Offloading: Complex capital commitments—such as the multi-step acquisition agreement for Webster Financial Corporation—coupled with ongoing negotiations for over $17.5 billion in significant risk transfer (SRT) deals, heighten execution challenges and highlight balance sheet credit risks.
- Historical Dividend Distribution Instability: An unstable payout track record, including historical annual dividend drops exceeding 20%, creates persistent uncertainty regarding long-term capital return stability for institutional holders.
Find out more