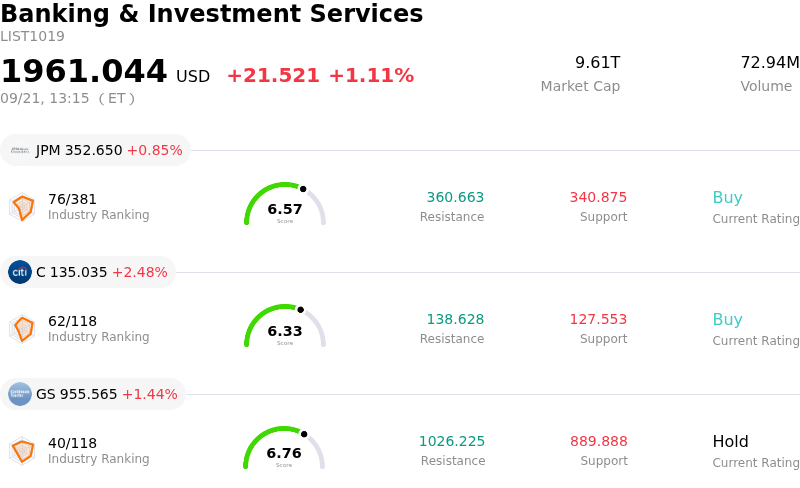
Interactive Brokers Group Inc (IBKR) moved up by 3.24%. The Banking & Investment Services sector is up by 1.11%. The company outperformed the industry. Top 3 stocks by turnover in the sector: JPMorgan Chase & Co (JPM) up 0.87%; Citigroup Inc (C) up 2.48%; Goldman Sachs Group Inc (GS) up 1.44%.
What is driving Interactive Brokers Group Inc (IBKR)’s stock price up today?
Interactive Brokers Group experienced upward price action supported by persistent strength in fundamental growth metrics and sustained momentum in global account expansion. Investor optimism remains anchored by robust monthly operational performance, characterized by rapid account growth, expanding total client equity, and resilient trading activity across major asset classes such as options, equities, and futures. The company's recent strategic initiatives to broaden international market connectivity across new regional financial markets have further reinforced market confidence in its ability to capture incremental global market share relative to legacy brokerage peers.
Beyond organic account acquisition, the company continues to benefit from favorable underlying revenue drivers, including elevated client credit balances and strong margin loan demand, which collectively bolster net interest income. While shifts in macroeconomic interest rate expectations create periodic intraday trading volatility, Interactive Brokers maintains a highly automated, low-cost operating structure that provides superior profit margin resilience. This structural advantage allows the firm to sustain high profitability while offering competitive pricing, making it an attractive position for institutional portfolios in the capital markets sector.
The intraday volatility observed during the session reflects broader financial sector repositioning as market participants digest recent macroeconomic data and ongoing monetary policy signals. However, buyer demand stepped in aggressively as institutional investors prioritized high-quality financial technology models with robust balance sheets and scalable execution platforms. Positive analyst coverage regarding the firm's expanding international footprint and multi-year earnings growth trajectory further reinforced positive trading sentiment through the close.
Technical Analysis of Interactive Brokers Group Inc (IBKR)
Technically, Interactive Brokers Group Inc (IBKR) shows a MACD (12,26,9) value of -0.151, indicating a sell signal. The RSI at 54.908 suggests neutral condition and the Williams %R at 12.575 suggests overbought condition. Please monitor closely.
Media Coverage of Interactive Brokers Group Inc (IBKR)
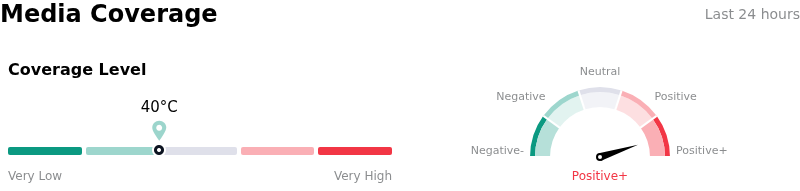
In terms of media coverage, Interactive Brokers Group Inc (IBKR) shows a coverage score of 40, indicating a low level of media attention. The overall market sentiment index is currently in extremely bullish zone.
Fundamental Analysis of Interactive Brokers Group Inc (IBKR)
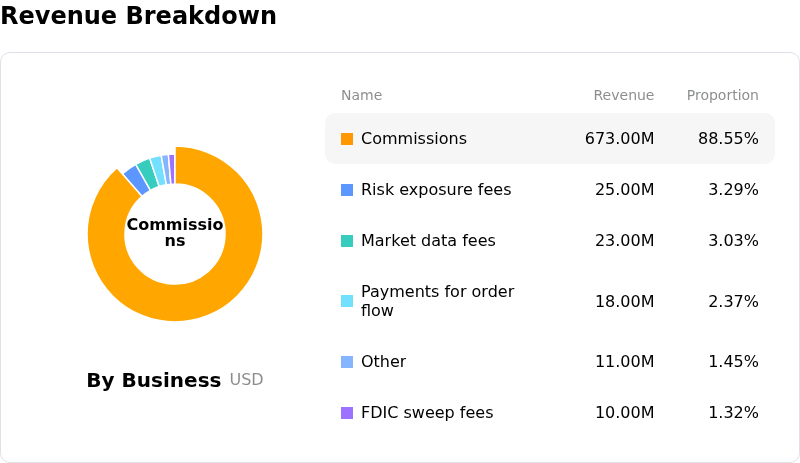
Interactive Brokers Group Inc (IBKR) is in the Banking & Investment Services industry. Its latest annual revenue is $10.00B, ranking 24 in the industry. The net profit is $984.00M, ranking 24 in the industry. Company Profile
Over the past month, multiple analysts have rated the company as Buy, with an average price target of $105.91, a high of $121.00, and a low of $72.18.
More details about Interactive Brokers Group Inc (IBKR)
Company Specific Risks:
- Analyst Downgrades and Stretched Valuation Multiples: Wall Street analysts, including UBS, recently downgraded Interactive Brokers to Neutral following a sharp run-up in its stock price, warning that its current premium valuation (around 38x P/E) leaves little margin for error and heightens downside volatility if growth misses aggressive market expectations.
- Net Interest Margin Vulnerability to Rate Policy Shifts: Because a significant portion of IBKR's revenue depends on net interest income from client cash and short-term yields, ongoing Federal Reserve interest rate adjustments and shifts in client uninvested cash deployment threaten to erode net interest margins.
- Credit Risk and Volatility Exposure from Margin Loan Expansion: Rapid growth in client margin loan balances exceeding $100 billion increases IBKR's operational and liquidating risk during sharp intraday market downturns or sudden spikes in Treasury yields, potentially leading to forced liquidations or unexpected credit losses.
- Slow Revenue Conversion on Strategic Expansion Initiatives: Capital deployment into new product verticals—such as prediction markets, cryptocurrency trading, and expanded foreign exchange access—presents operational friction and regulatory compliance burdens while failing to generate near-term top-line revenue additions.
Find out more