TradingKey - As of the European session on September 24, gold prices (XAUUSD) extended their correction, dipping below $4,300 intraday to hit a low of $4,262.45. After previously rebounding close to $4,400, gold prices retreated continuously and have now broken below the psychological $4,300 level, with the short-term trend weakening significantly.
Fed Rate-Hike Expectations Rise, But Falling Oil Prices Limit Gold Losses
In the near term, the main pressure on gold continues to stem from Federal Reserve policy expectations. The preliminary U.S. September Composite PMI rose to 58.4, reaching its highest level since July 2021 and showing that economic activity remains robust. Meanwhile, Federal Reserve Governor Michael Barr stated that further rate hikes may still be needed in the future to bring down inflation. Following the data release, the market's expected probability of another rate hike in October rose from 55.4% to 75.3%, and the 10-year U.S. Treasury yield rose to 5.148%, reaching a new high since 2007. A stronger U.S. dollar and elevated Treasury yields continue to increase the opportunity cost of holding non-yielding gold, keeping gold prices under pressure and continuing to pull back.
However, the pullback in oil prices is providing some support for gold. Iran stated that it remains willing to end its conflict with the U.S. through diplomatic means and is evaluating the U.S. response to the peace plan. Driven by negotiation expectations, WTI crude fell about 0.8% in early Thursday trading to $91.23, and Brent crude briefly fell below $100. If U.S.-Iran negotiations continue to make progress and drive energy prices down, future U.S. inflation pressures may ease accordingly, reducing the need for sustained Fed rate hikes and thereby supporting a rebound in gold prices.
Gold Price Technical Analysis
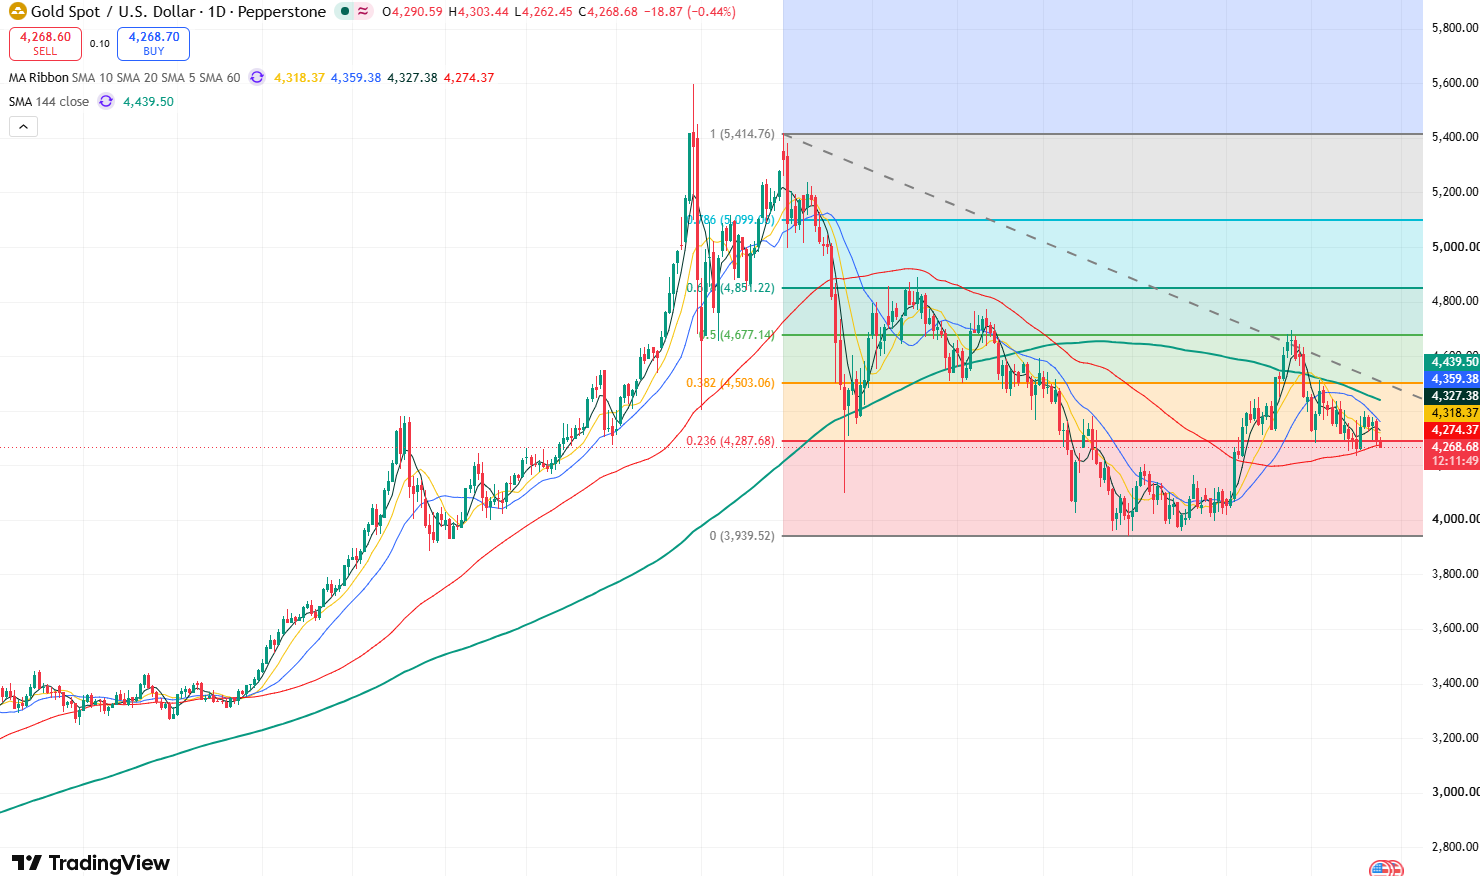
Gold price daily chart, Source: TradingView
Looking at the daily chart of gold prices, gold has continuously pulled back from near $4,400 and has currently broken below $4,300, indicating that market bearish sentiment clearly dominates. Meanwhile, in terms of technical indicators, short-term moving averages and the MACD indicator both show weakness, while the RSI index stands around 43 in weak territory without entering oversold territory, showing that short-term selling pressure still holds the upper hand.
At present, gold prices have once again retested the 60-day moving average near $4,270, briefly dipping below this level intraday. If today's closing price ends below this level, gold prices may continue to pull back in the short term; if prices hold firm above this level, gold prices will see a technical corrective rebound in the short term.
On the downside, the primary support level to watch below is the September 16 low of $4,235. If this level fails to hold, gold prices may test the $4,200 mark downward. If the decline continues, gold prices could fall further toward the $4,000 mark.
On the upside, the primary resistance level to watch above is $4,300. If gold can hold firm above this level, it will continue to test $4,400 upward, with potential to rise further to near $4,510.
Find out more