TradingKey - On October 7 Eastern Time, Western Digital (WDC) closed down 1.37% at $405.42, falling about 12.5% from its intraday high of $463.55 on October 1.
On October 2, Nikkei Asia reported that Toshiba plans to invest approximately 60 billion yen to expand its plant in the Philippines, with plans to roughly double its capacity for data center nearline HDDs in fiscal year 2027 ending March 2028 compared to fiscal year 2025.
On the day the news was announced, WDC closed down 10.2% at $415.29, touching an intraday low of $396.57, with a trading volume of approximately 24.77 million shares.
In February 2025, Western Digital completed the spinoff of its flash memory business, with SanDisk (SNDK) becoming an independent publicly listed company, while WDC subsequently focused on its HDD business. Toshiba's planned expansion of nearline HDDs directly competes with Western Digital's data center storage products, raising market concerns over increased industry supply and intensified price competition.
Toshiba Said to Invest 60 Billion Yen to Expand Nearline HDD Capacity
According to a Nikkei Asia report, Toshiba plans to invest approximately 60 billion yen to expand its factory in the Philippines, aiming to roughly double its nearline HDD capacity by storage volume in fiscal year 2027 (ending March 2028) compared with fiscal year 2025. This will mark Toshiba's first major investment in its HDD business in about five years.
The report noted that Toshiba aims to raise its global HDD market share by shipped capacity from slightly above 10% to 30% over the medium term. This target is not capacity guidance for fiscal year 2027, nor has Toshiba officially confirmed the investment plan. Final progress remains subject to the mass production of high-capacity hard drives, component supply, customer qualification, and securing orders.
TD Cowen projects that even if Toshiba completes its expansion, its global HDD market share may only rise to 15%–17%, adding roughly 75 EB of supply, which is below the current industry supply deficit of around 300 EB. The firm expects global HDD storage capacity demand could still grow by about 30% in both 2027 and 2028; therefore, Toshiba's expansion may not be sufficient to alter tight industry supply-demand dynamics in the short term.
Impact of Toshiba's Capacity Expansion May Emerge Around 2028
Toshiba plans to roughly double its nearline HDD capacity in fiscal year 2027 ending March 2028. As capacity expansion requires equipment installation, component supply, product qualification, and production ramp-up, analysts expect that its noticeable impact on industry supply and pricing may begin around 2028. Seagate and Western Digital have locked in part of their shipment volumes and pricing through long-term agreements, so the near-term market landscape is not expected to change rapidly.
AI data centers continue to expand their storage capacity. Continuous growth in training datasets, model files, checkpoints, and execution logs is driving cloud service providers to increase deployments of high-capacity storage. In scenarios such as cold data, backup, and archiving, nearline HDDs typically offer a lower cost per unit of capacity than enterprise SSDs, and demand remains supported by data growth.
Western Digital reported fourth-quarter fiscal 2026 revenue of $3.75 billion, up 44% year-over-year. GAAP gross margin rose to 54.1%, and operating margin increased to 41.7%; non-GAAP gross margin and operating margin were 54.4% and 44.2%, respectively. The company expects first-quarter fiscal 2027 revenue of $4.0 billion to $4.2 billion and non-GAAP earnings per share of $3.85 to $4.15.
The ultimate impact of Toshiba's capacity expansion on WDC still depends on the pace of new supply relative to demand growth. If AI data center demand is sufficient to absorb the new capacity, HDD prices and vendor margins may remain stable; however, if Toshiba successfully completes high-capacity product qualifications and expands orders from cloud service providers, WDC's market share, pricing power, and margins will face pressure.
WDC Technical Analysis: $397 Becomes Key Short-Term Support
From a medium-term swing perspective, based on the move from the intraday low of $249.06 on March 30 to the intraday high of $799.87 on June 18, the 0.500, 0.618, and 0.786 Fibonacci retracement levels are approximately $524.47, $459.47, and $366.93, respectively. WDC remains below the 0.618 retracement level, indicating that its medium-term trend has not yet significantly strengthened.
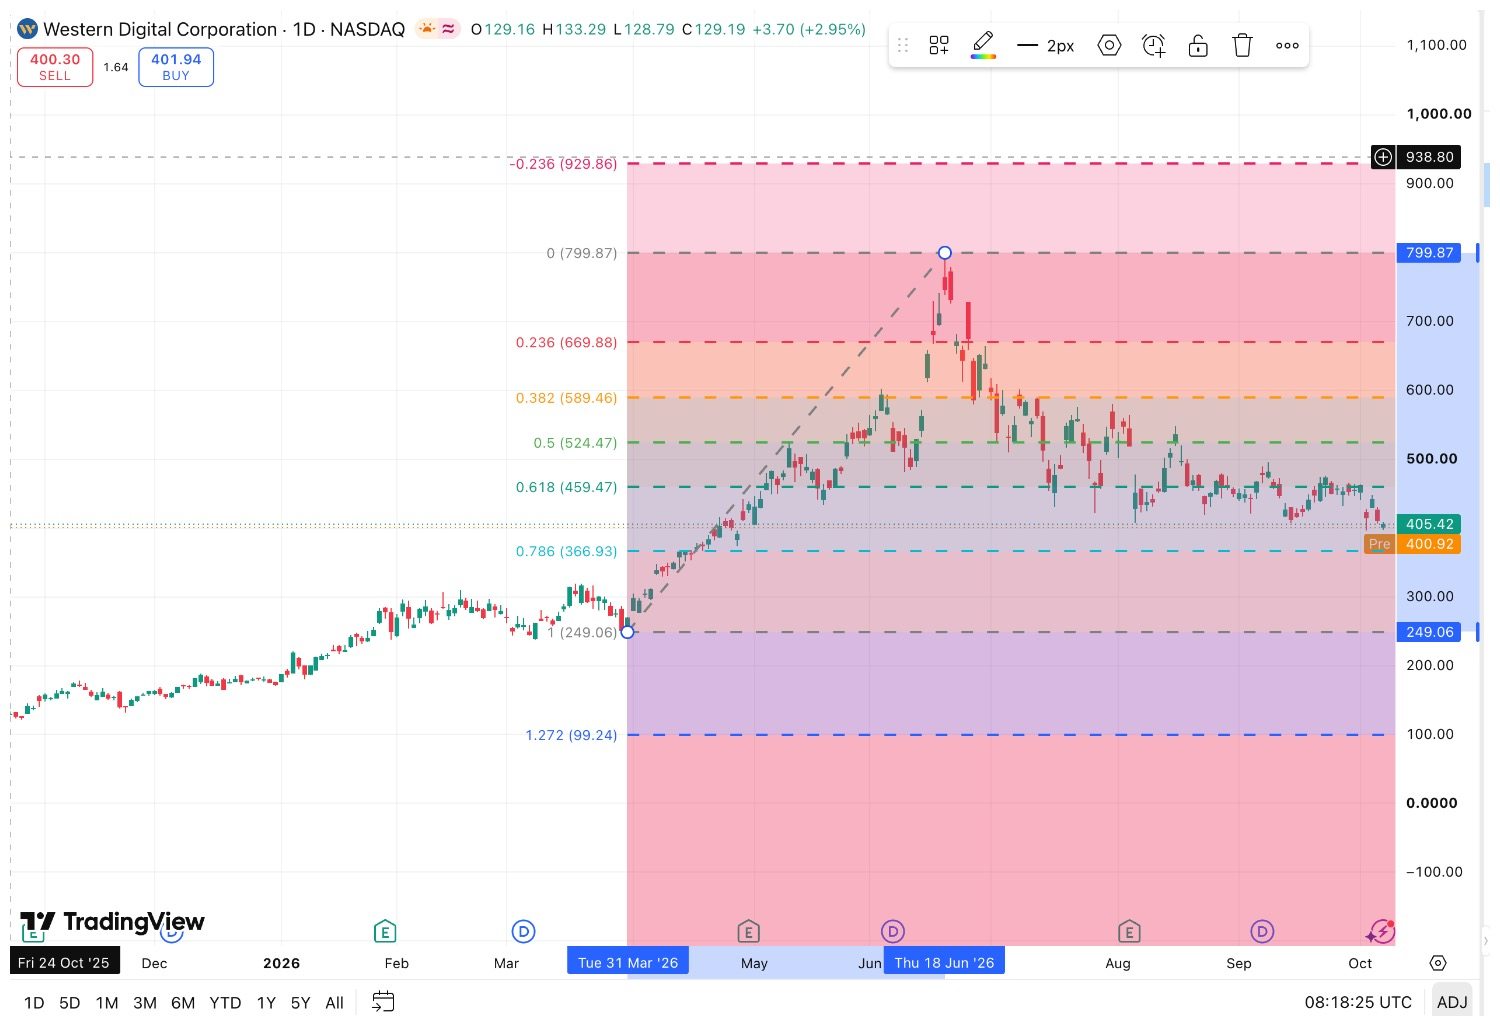
[Source: TradingView]
From a short-term swing perspective, based on the move from the intraday high of $463.55 on October 1 to the intraday low of $396.57 on October 2, the 0.236, 0.382, 0.500, 0.618, and 0.786 rebound levels are approximately $412.38, $422.16, $430.06, $437.96, and $449.22, respectively.
On the upside, WDC first needs to establish a firm footing at $410–$413, after which attention can turn to $422 and $430. If it breaks out further above $438–$449, the next key resistance zone lies at $459–$464. Once firmly above this zone, subsequent targets to watch are $495–$500 and $524–$525.
To the downside, $396.57–$397.19 forms a near-term support zone. If it breaks below this area on a daily closing basis, the next model observation range will be $378–$380, where $378.35 corresponds to the short-term 1.272 downside extension level. If weakness persists, medium-term support lies at $366–$367.
Overall, the area around $397 determines the short-term structure, while $459–$464 is the key zone for a medium-term trend strengthening. Holding above $397 and reclaiming $422 would favor a continuation of the rebound; a breakdown below $397 would warrant attention sequentially on $378–$380 and $366–$367.
Find out more