TradingKey - At Thursday's close (November 5) Eastern Time, SanDisk (SNDK) shares tumbled 22.26% to close at $806.43, having touched an intraday low of $803.97, with trading volume rising to approximately 30 million shares, more than triple its 20-day average volume. Over the past week, the stock has dropped nearly 40% cumulatively, retreating about 66% from its all-time high of $2,354.39 in June, as its recent correction widened further.
Thursday's sharp decline in SanDisk was linked to broad-based weakness across the AI and storage sectors. Following the release of the U.S. midterm election results, the market began focusing on the risks of potentially tighter regulations on AI data center construction, power usage, and regulatory approvals going forward. Because SanDisk's enterprise NAND and SSD demand is closely tied to data center expansion, the shift in expectations weighed on storage stocks as a whole. On that day, the Nasdaq Composite Index fell more than 5%, semiconductor ETFs dropped over 10%, and Micron Technology, Western Digital, and Seagate also plunged.
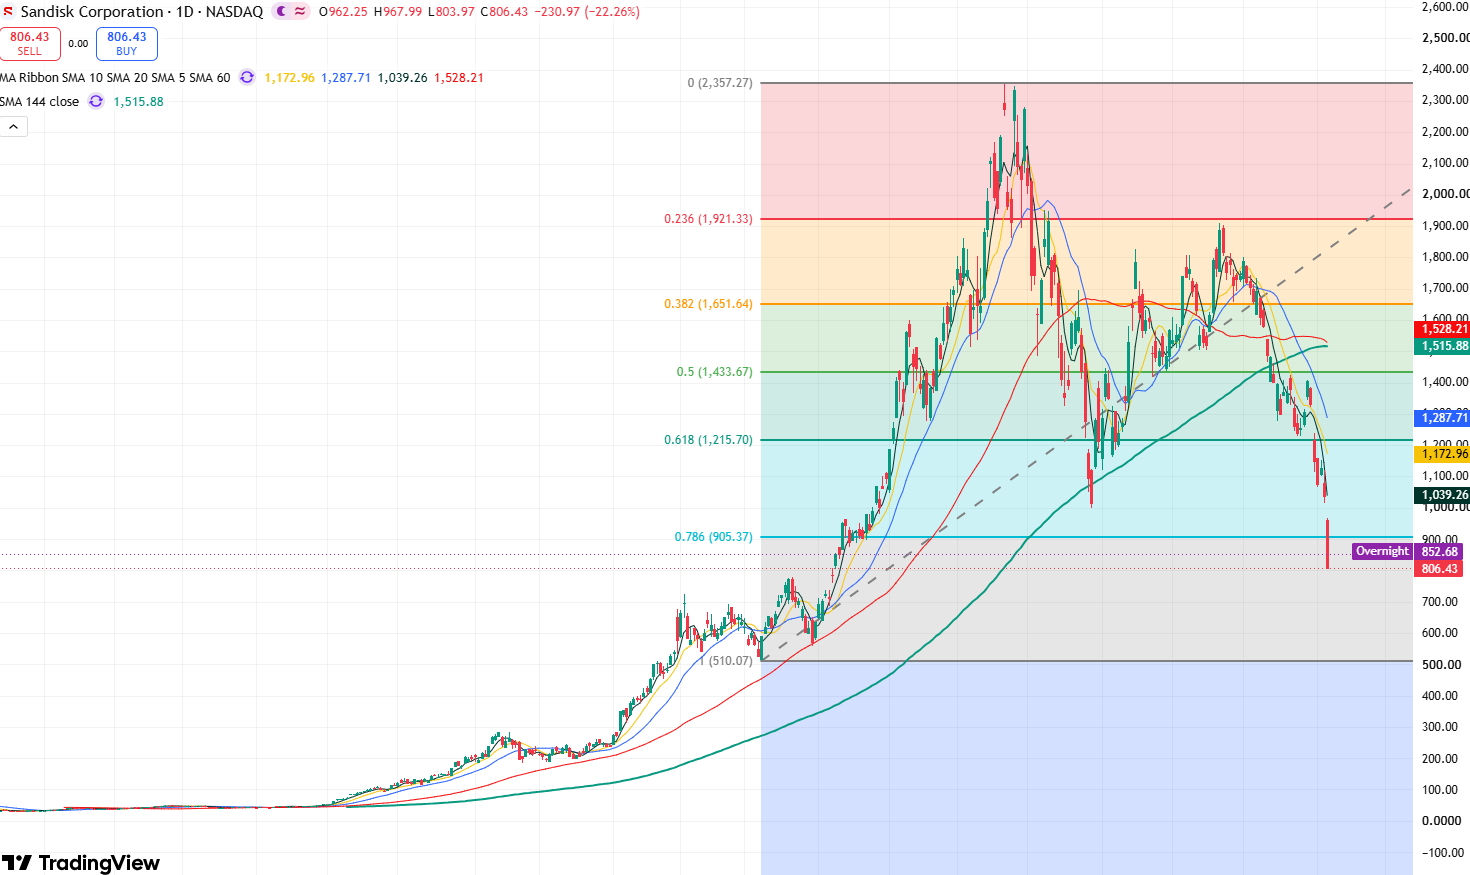
SanDisk daily stock price chart, Source: TradingView
From SanDisk's daily stock chart, following Thursday's sharp decline, the stock has broken below the key support level at the $1,000 threshold and further breached the $900 support level to test near $800, indicating that the stock's medium-term bullish structure has been broken and the price may enter an extended phase of correction.
Regarding technical indicators, the Relative Strength Index (RSI) stands at 24.2, entering oversold territory, while the MACD remains negative, indicating that downward momentum has not yet fully reversed. The RSI suggests that a short-term rebound may occur, but room for a rebound could be limited.
Currently, the stock's post-market price has rebounded from Thursday's close of $806 to around $860, showing a technical relief rebound following oversold conditions. However, it faces initial resistance at $900 above. If the stock can break above this level, it will continue upward to test the key resistance level of $1,000. If the stock can break through and hold above this level, it will open up upside toward $1,200.
Conversely, if the stock fails to hold above $1,000, it will continue its downward trend, with the primary downside target testing support around $800-$780. If it falls below $780, it will continue downward to test the resistance level near $700. If this level is lost, the stock could pull back further toward its March low near $517.
Find out more