TradingKey - As of Monday's close (November 9) Eastern Time, TSMC (TSM) ADR rose 3.51% to $388.62, reaching an intraday high of $394.39 on a trading volume of approximately 15.65 million shares, and edged up further to around $393 in after-hours trading. Previously, TSM plunged 10.78% in a single day on November 5, touching a low of $351.19, before rebounding for two consecutive trading sessions, now having recovered more than 10% from its recent low.
From a fundamental perspective, TSMC released its latest monthly revenue report on November 10, showing consolidated revenue of approximately NT$586.89 billion for October, up 14.7% month-over-month and surging 59.7% year-over-year. Cumulative revenue from January through October reached NT$4.486 trillion, representing a year-over-year increase of 43.3%. This growth rate was notably higher than the company's overall revenue growth pace year-to-date, indicating that demand for advanced manufacturing processes and AI-related chips continues to provide strong support for revenue.
Previously, TSMC had posted record profits for a sixth consecutive quarter in the third quarter, while maintaining a relatively prudent outlook for 2027. Therefore, beyond monthly revenue growth, investors still need to keep a close eye on AI demand, advanced process capacity, and changes in capital expenditures.
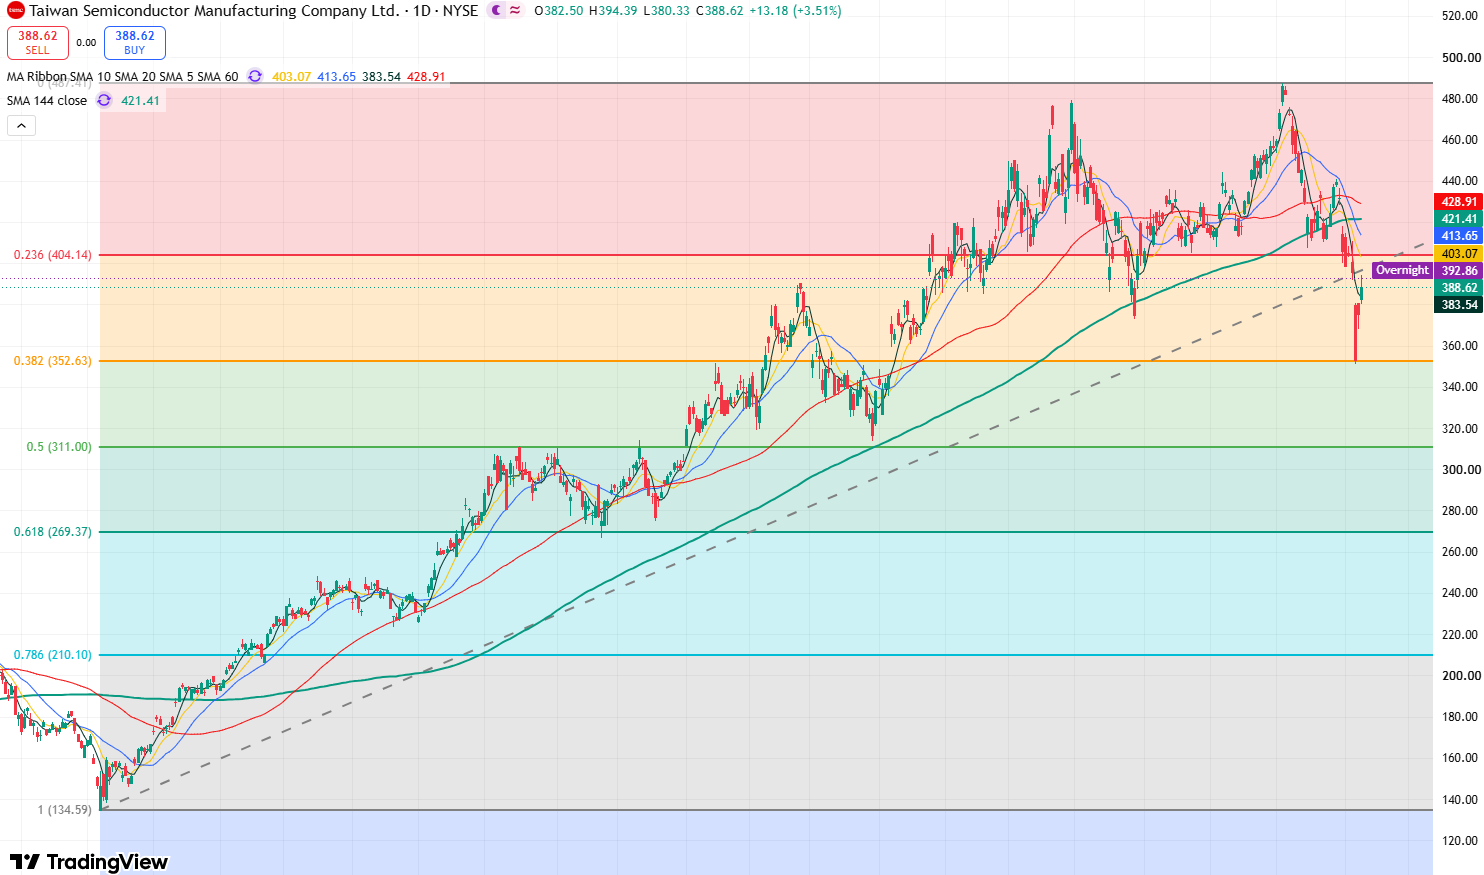
TSM daily stock chart, Source: TradingView
Looking at TSM's daily stock chart, following a continuous correction since late October, the stock fell to a low of $351.19 on November 5, near the Fibonacci 0.382 retracement level, which provided some support. It subsequently rose 6.33% on November 6 and gained another 3.51% to $388.62 on November 9. Following two consecutive sessions of rebound, the short-term price structure has shown clear signs of repair, and the stock may extend its rebound in the near term, with the primary target testing the $400-$410 resistance zone.
At present, although the stock has rebounded for two trading sessions, it remains capped by the 10-day and 20-day moving averages. Therefore, the current move is still a rebound phase following the prior sharp pullback, and the medium-term trend has not yet fully recovered.
On the upside, the primary overhead resistance to watch is $400-$410. Only when the stock breaks out decisively and holds above $410 will greater upside potential open up, paving the way for a further test of the resistance near $440. If that level is breached, the stock will once again challenge the $500 mark.
On the downside, the primary support level to watch is $380. If this level fails to hold, the stock will test the $368-$370 range. Continued declines could see the stock fall further toward the key support near $350.
Find out more