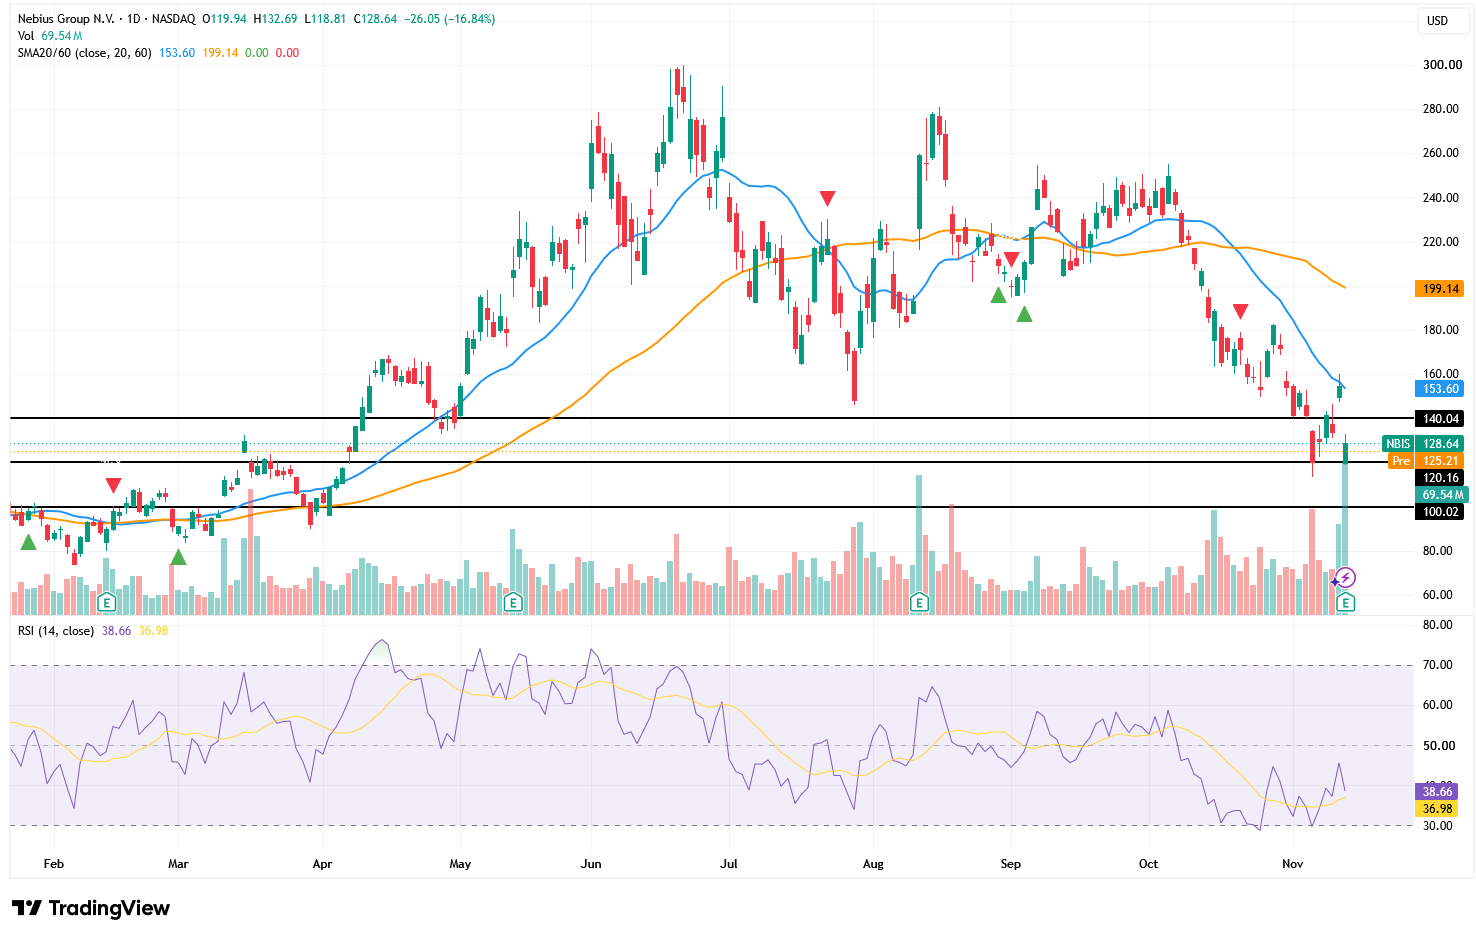
TradingKey - Nebius (NBIS) suffered concentrated selling after reporting its third-quarter financial results, with shares tumbling 16.84% on Thursday to close at $128.64 after touching an intraday low of $118.81, as trading volume surged to roughly 69.5 million shares. Although it reclaimed $120 late in the session, the stock has clearly broken below its 20-day and 60-day moving averages, and the short-term trend remains dominated by bears.
Judging from the earnings report, Nebius's business growth was not weak. Third-quarter revenue reached $981 million, surging 571% year-over-year and beating market expectations of approximately $908 million. Within that, revenue from its core AI cloud business reached $974 million, up 643% year-over-year. Adjusted EBITDA swung from a loss of $5.2 million in the prior-year period to a profit of $466 million, and adjusted net income also reached $90.9 million.
The market's real concern is the cash burn behind the rapid growth. Nebius's expenditures on property, equipment, and intangible assets reached $7.3 billion in the third quarter, far higher than $956 million in the prior-year period. Net cash used in operating activities was $273 million, also widening significantly from $80.6 million a year earlier. Although the company was profitable on an adjusted basis, under GAAP it still posted a loss from continuing operations of $37.5 million, or a loss of $0.13 per share.
As global data center buildouts accelerate, Nebius expects capital expenditures to further reach $40 billion to $45 billion in 2027, while aiming to achieve pre-tax breakeven by the end of 2027. This means the company will still need to strike a balance between scaling computing power, curbing cash burn, and raising external funding. Even if long-term customer contracts provide order support, the massive upfront investments could still heighten the risks of debt, equity financing, and dilution for existing shareholders.
Source: TradingView
From a technical perspective, Nebius's closing price has fallen below both its 20-day moving average of $153.60 and its 60-day moving average of $199.14. Both moving averages are sloping downward, indicating that the medium- to short-term trend has yet to stabilize. The 20-day moving average poses initial dynamic resistance, while the $140 to $154 range serves as the primary resistance zone that any rebound must overcome. Only by reclaiming $154 and holding it for several trading sessions could the current downward structure potentially ease.
The 14-day RSI currently stands at around 38.66, slightly above the smoothed signal line of 36.98, suggesting that some buying support emerged after the stock breached $120 intraday. However, with the RSI remaining below 50, market momentum is still weak; for now, this can only be viewed as a localized technical rebound from oversold conditions, which is insufficient to confirm a bottom.
On the downside, the first level to watch is $120. This mark served as a battleground during Thursday's session and sits near recent lows. If the stock effectively closes below this level, selling pressure could push it toward $110 and subsequently test the $100 psychological round-number mark. A decline from $120 to $100 represents a potential drop of roughly 17%. The $100 level also corresponds to a heavy volume cluster formed earlier this year, which could serve as the next psychologically significant support level.
If Nebius can hold $120 and break back above $140, the stock is poised to mount a recovery toward around $154. However, with both moving averages yet to be reclaimed and capital expenditure pressure still unrelieved, any rebound is more likely to be treated as a technical correction within a downtrend. In the short term, whether $120 can hold will directly determine whether the stock builds a temporary bottom or continues downward to seek support at $100.
Find out more