RSBT: Why I'm About To Start Buying This 7.4% Yielding ETF

shapecharge
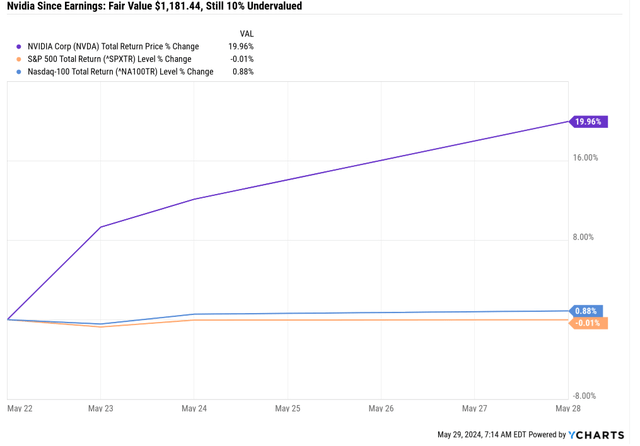
It's always exciting to watch stocks like Nvidia (NVDA)(NVDA:CA) soar to new heights after delivering another stellar earnings report.
Ycharts
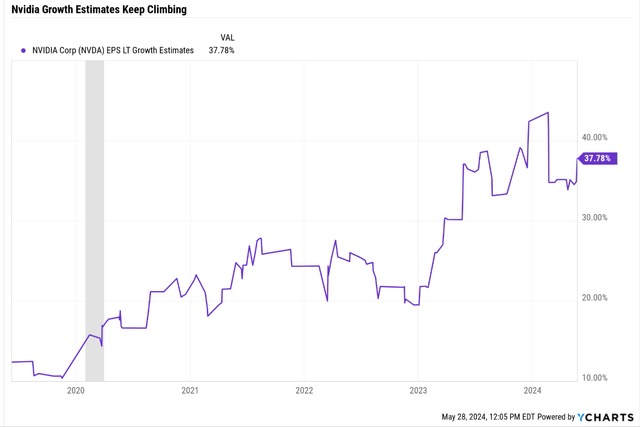
Post earnings, NVDA's earnings estimates have increased by 5% for 2024 and 10% for 2025, and its long-term growth outlook is now soaring to an impressive 38%.
Ycharts
While it's exciting to see your portfolio hitting record highs, it's crucial to prioritize risk management first.
Remember, good times are always followed by a correction or even a bear market. It's not about what you make, but what you keep long-term that genuinely matters.
Bad Risk Management Leads Can Lead To Terrible Investment Outcomes
Ben Carlson is an RIA for Rithotlz Wealth Management and once shared on his podcast the story of a client that exemplifies the dangers of market timing.
In January 2008, he watched a presentation on YouTube that convinced him that a credit crisis would tank the economy and the stock market. The doomsday prophet said the S&P was going to 500, a 69% crash.
The client sold everything and went to cash but assured Mr. Carlson that he would start to buy back into the S&P starting at 600, a 62% market crash.
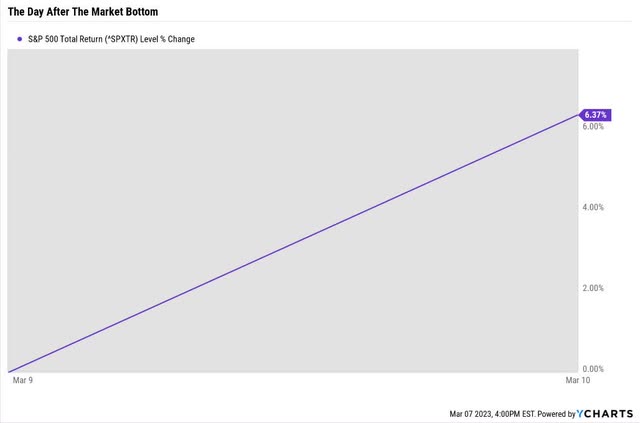
The S&P bottomed at 666 on March 9, 2009.
Ycharts
The next day, it was up 6%.

Ycharts
Within a month, it was up 27%.
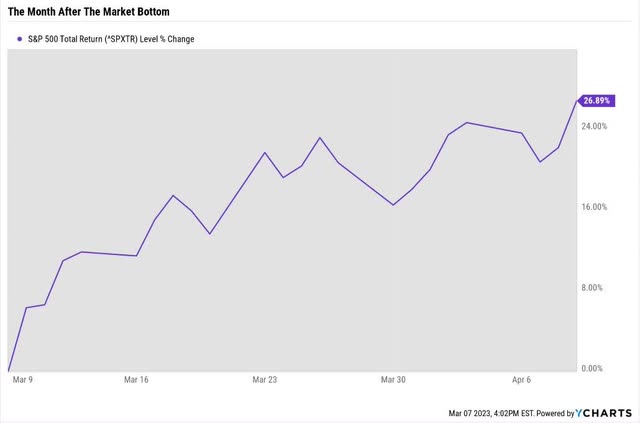
Ycharts
It was up 27% within a month, and the news on the economy was still getting worse.
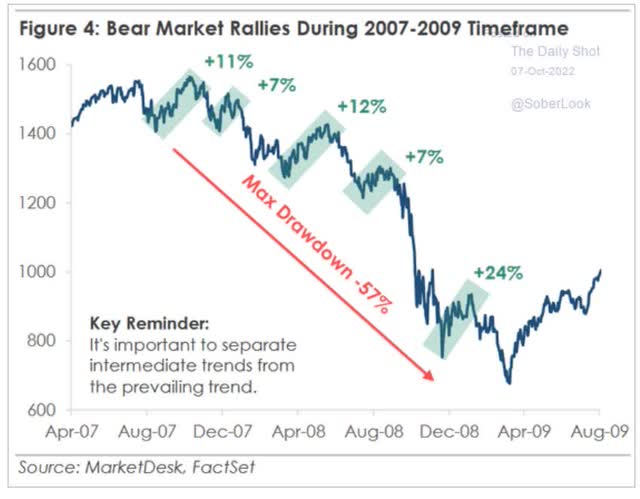
Daily Shot
There had been plenty of bear market rallies during the crisis, and this client's doomsday prophet assured him the S&P would fall to 500; the models were clear.
Mr. Carlson's client sat in cash for four years, earning virtually nothing, while the stock market did this.
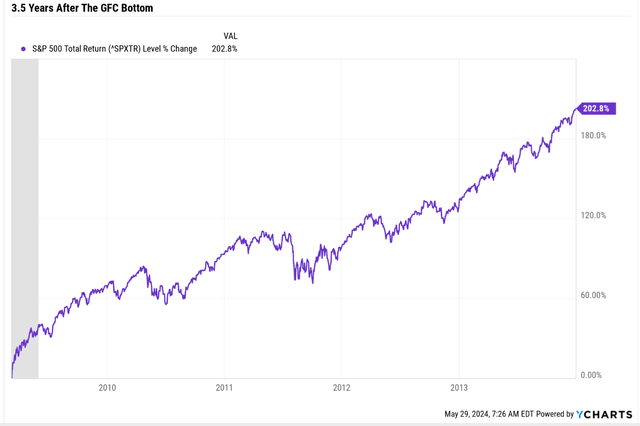
Ycharts
This man got "lucky" and avoided a 40% decline. He then sat in cash, for had he not gotten "lucky" with his market timing call, he would have 80% more money than he did. Market timing requires luck to get out and luck to get back in.
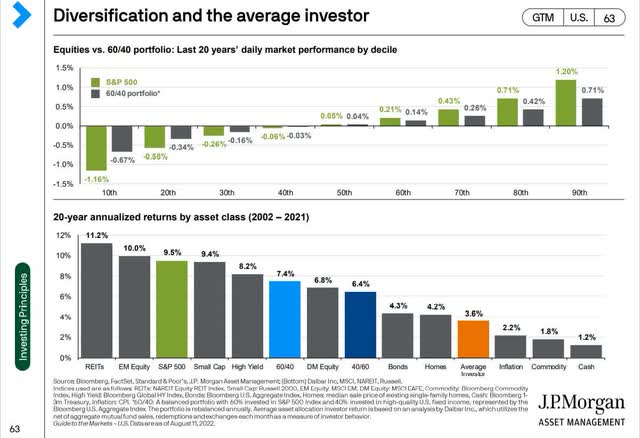
JPMorgan Asset Management
The average investor can't time the market, and neither can professionals.
Asset Allocation Is The Key To Investing Success
DK S&P Valuation Tool
Stock picking is only marginally significant to long-term returns. According to Raymond James and Vanguard studies, 86% to 88% of long-term returns are due to asset allocation.
DK S&P Valuation Tool
The real secret to long-term investing success is sleeping soundly during market downturns. You can spend endless hours researching the best companies, but without the proper asset allocation tailored to your needs, even God's own investment plan won't protect your portfolio. It's not just about picking winners. It's about crafting a strategy that lets you confidently weather any storm.
My message to you is the science-based magic and diversification-fueled sorcery that's thoughtful asset allocation.
I will start building a 15% position in the Return Stacked Bond-Trend ETF (BATS:RSBT), which will likely take one to three years to complete. This will give RSBT time to prove its effectiveness in reality, not just theory or backtests.
Supposing RSBT continues to prove itself over time. In that case, it will eventually replace my current 15% allocation to the PIMCO 25+ Year Zero Coupon US Treasury Index ETF (ZROZ), the longest-duration US treasury ETF on Wall Street.
Why change my asset allocation to eliminate long-duration bonds? RSBT return stacks trend-following managed futures on top of US treasuries to improve diversification.
That makes for a better hedging bucket and a better portfolio. Let me show you why.
Part 1: How RSBT Works.
Part 2: Why diversification is the only "free lunch" on Wall Street.
Part 3: How I'm applying return stacking to my own portfolio.
Part 1: Return Stacked Bonds & Managed Futures ETF- A Better Choice Than My Long Bond Strategy
Note that RSBT pays out 100% of profits yearly as cash dividends. The 7.4% yield is the future expected return based on the backtested strategy returns since 2000.

Corey Hoffstein
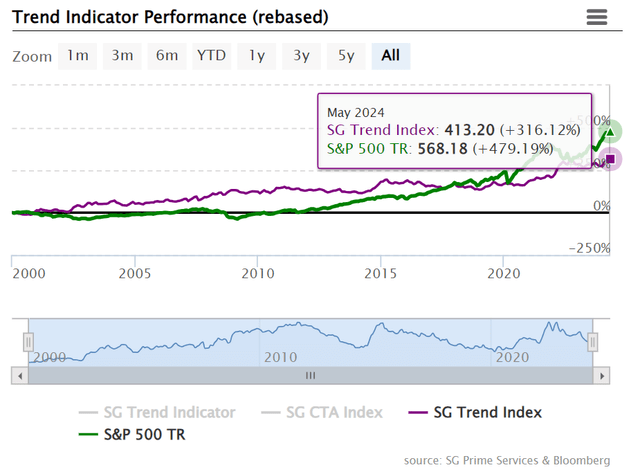
How did bonds do? Return stacking bonds and the Soc Gen Trend index resulted in a net return of 8.4%.
Here's how Bonds did—the default hedging option.
- Cumulative Return (2000-2023): Approximately 212%
- Annualized Return (2000-2023): Approximately 3.3%
The Soc Gen Trend Index has improved its returns since 2023 and has been up 6.4% annually since 2000. That means a potential 0.7% higher return for RSBT's strategy, though I can't confirm that. So, I'm using 8.4% historical returns—1% expense ratio = 7.4% net return to investors (and the yield since RSBT pays out all gains as an annual dividend).
- Potential yield/long-term return 8.1% vs 8.2% KMLM.
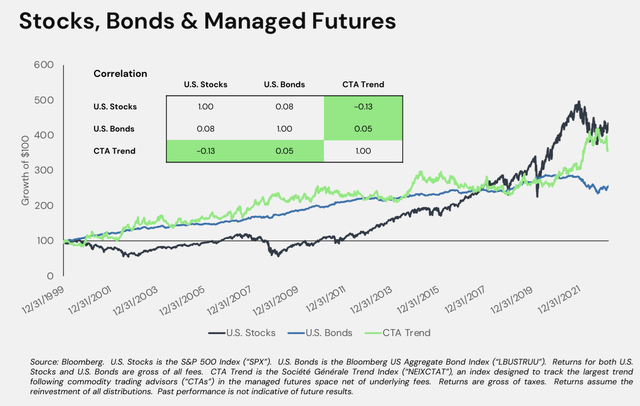
How does RSBT "stack" extra returns on top of bonds? How does this generate better returns with lower volatility? When combined with KMLM (KMLM), can I create the most negatively correlated (best hedging) combination I've yet discovered?
- -0.66 in the four worst bear markets of the last 33 years.
How RSBT Works
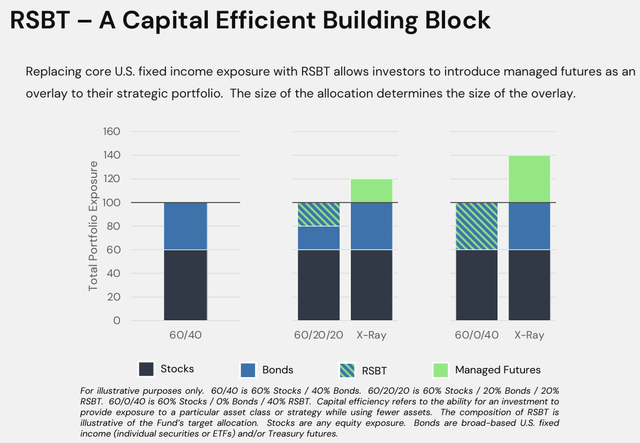
Return Stacked Funds
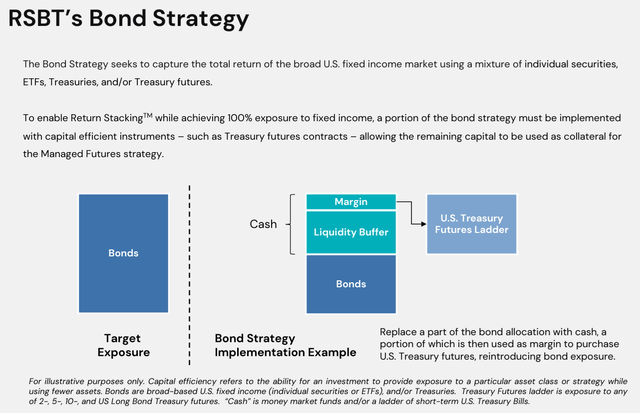
RSBT allows you to replace some of your bond allocations, 15% in my case, with 15% bonds plus 15% managed futures.
You gain the benefit of diversification from a non-correlated asset.
Return Stacked Funds
Without sacrificing your bond allocation. In other words, it's not either bonds and managed futures; with return stacking, it's "yes to bonds and to managed futures."
How does this work?
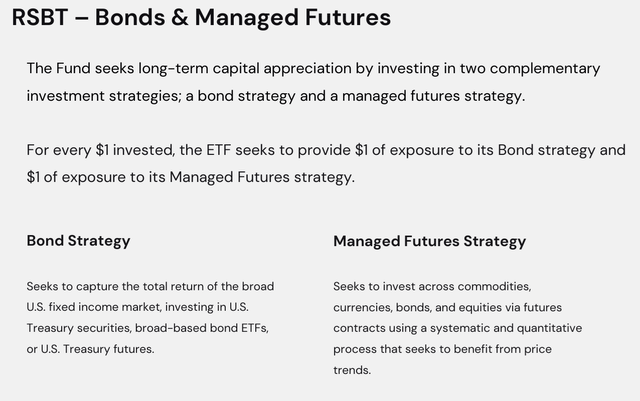
Return Stacked Funds
$1 in RSBT buys $1 in bond exposure and $1 in managed futures exposure, replicating the Soc Gen Trend index.
Let's break that down step-by-step so you understand how this ETF works.
Return Stacked Funds
50% of your $1 investment goes into iShares Core U.S. Aggregate Bond ETF (AGG). The other $0.50 goes into cash, T-bills, which are then used as collateral to buy bond futures, a ladder of 2, 5, 10, and 30-year US Treasuries.
According to Corey Hoffstein, CEO of Newfound Research, who manages the bond part of Return Stacked Funds, the overall bond exposure is designed to mimic the Barclays Agg index, with a duration of 6 to 7 over time.
The remaining cash is then used as collateral for the managed futures portfolio.
More On Return Stacking ETF Options
- RSST: A Potential 13.5% Yielding Alternative To JEPI I'm Considering Buying
An Introduction to Managed Futures.
- KMLM: 5 Reasons You Might Want To Buy This 8.2% Yielding ETF
Return Stacked Funds
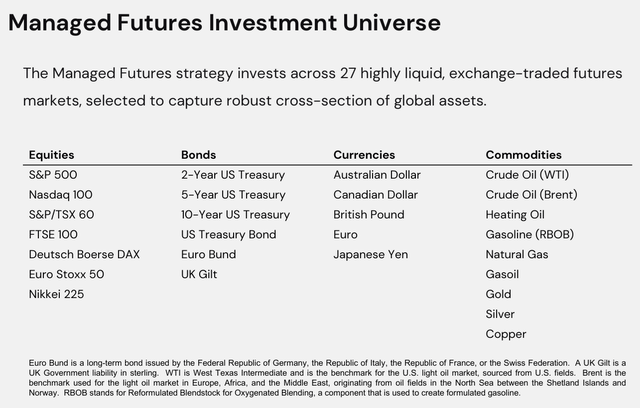
Those are the 27 liquid futures contracts used in the strategy that approximate the Soc Gen trend index.
Return Stacked Funds
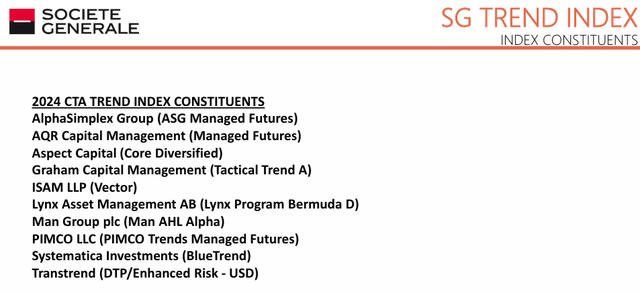
The Soc Gen Trend index comprises the ten largest trend-following managed futures fund managers.
Soc Gen
The returns since inception for this index are 6.4% annually.
Return Stacked Funds
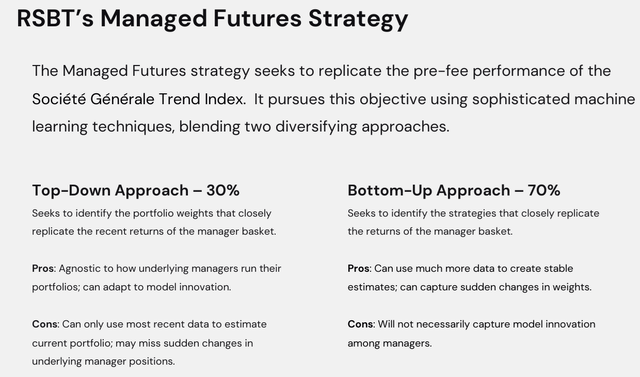
Resolve Asset Management runs the managed futures strategy using a machine learning algorithm that replicates the asset allocations of the Soc Gen Trend index using a 70% bottom-up approach (strategy-focused) and 30% top-down approach (individual position-focused).
Return Stacked Funds
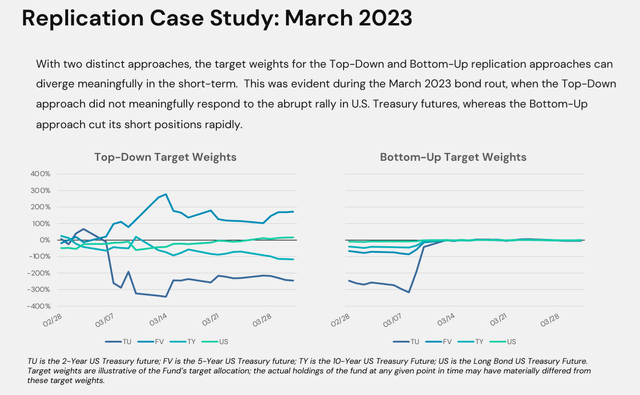
Bottom up is a faster-moving way of adjusting the portfolio. In the Regional banking crisis, the bond market had the strongest weekly gain in 42 years, and all trend followers were historically short bonds.
Top-down managers remained short bonds much longer, while bottom-up managers quickly went neutral.
How The Stacking Works
The borrowing costs have averaged 0.4% above the risk-free T-bill rate (Fed funds + 0.4%).
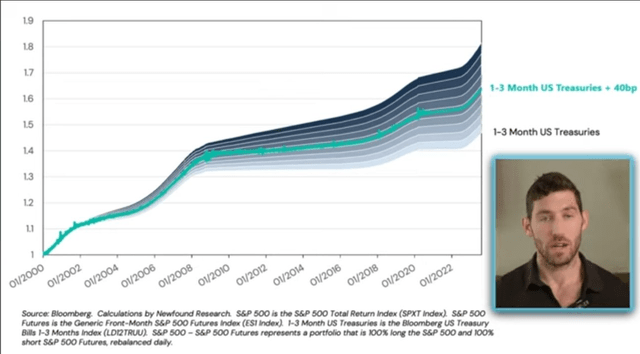
Newfound Research
In other words, the "stacked" returns equal the excess total return - 0.4%.
That's the gross return and the 1% expense ratio (0.97%).
Return stacking stacks excess returns minus expenses on top of the core asset, either stocks or bonds.
That's how you theoretically get higher returns over time while benefiting from the diversification benefits of non-correlated assets.
Now that you know what RSBT is let me show you why increasing diversification is generally better and that all else is equal.
Management: Who Is Managing Our Money?
Who runs the bond strategy?
Newfound Research LLC is a Boston-based quantitative investment and research firm founded in August 2008. The firm is dedicated to helping investors navigate the risks of investing through innovative strategies and thought leadership.
Newfound Research employs a quantitative approach to investment management, focusing on systematic strategies that are grounded in rigorous research and empirical evidence.
Corey Hoffstein is the co-founder and Chief Investment Officer (CIO) of Newfound Research, a quantitative investment and research firm. He is a prominent figure in the field of quantitative finance, known for his extensive research and innovative investment strategies.
Corey holds a Master of Science in Computational Finance from Carnegie Mellon University and a Bachelor of Science in Computer Science, cum laude, from Cornell University.
Professional Experience: Corey has been with Newfound Research since its inception in August 2008. He has played a crucial role in developing the firm's core momentum models, which have been instrumental in tactical asset allocation decisions for over $10 billion in assets" - Newfound Research
Who runs the managed futures strategy?
ReSolve Asset Management Inc. is a quantitative investment firm based in Toronto, Ontario, focusing on providing globally diversified and systematic investment strategies. The firm was established on Sept. 1, 2015, and has since grown to manage money for institutional and individual investors across Canada and the United States. ReSolve employs proprietary methodologies such as Adaptive Asset Allocation, Tactical Equity, and Risk Parity to construct portfolios."
The leadership team at ReSolve includes experienced professionals such as Jason Russell (President), Michael Philbrick (CEO), and Adam Butler (CIO). The team is recognized for their thought leadership in the investment community, having authored numerous research articles, whitepapers, and a book titled "Adaptive Asset Allocation: Dynamic Global Portfolios to Profit in Good Times – and Bad" - Resolve Asset Management
Risks To Consider: Why RSBT Isn't Right For Everyone
No ETF is perfect for everyone, and here are the risks to be aware of before buying RSBT.
Market Risk: The fund's value could decrease if the bond or futures markets decrease.
Stacking managed futures returns on top of bonds boosts returns long term because both strategies generate positive excess returns. However, the strategy can fail at any given time if trends rapidly reverse, as they did during the regional banking crisis.
Strongest Bond Rally In 42 Years After SVB Collapse
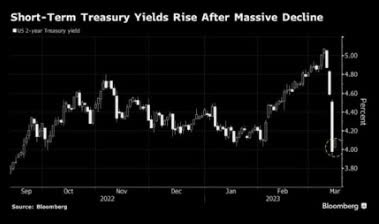
Bloomberg
This led to the worst week for managed futures funds in the history of the Soc Gen index.
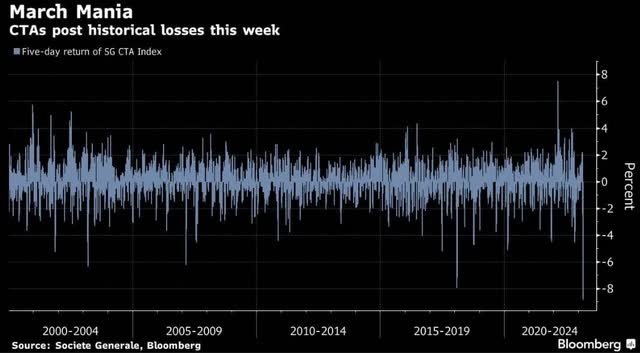
Bloomberg
A 9% decline in a single week, and you can see the carnage in the managed futures ETFs as well. That was a 25-sigma event (25 standard deviations).

Research Gate
March 2023
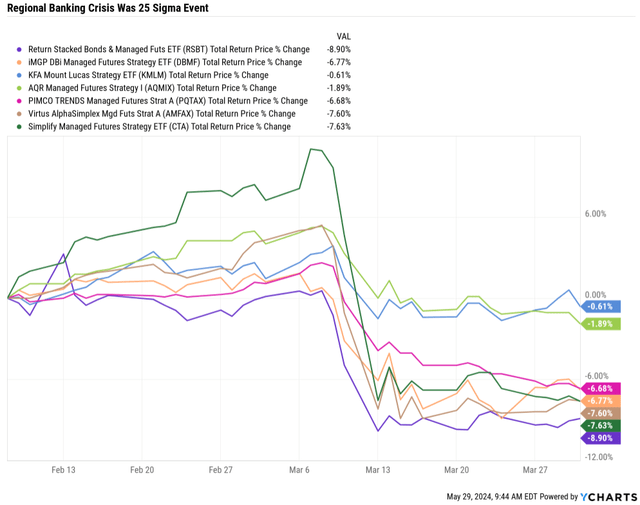
Ycharts
In March, the Soc Gen Trend index fell 4.6%, the S&P rose 3.5%, bonds rose 2.5%, and KMLM was flat, while RSBT suffered a relatively poor showing for a brand-new ETF.
It was the perfect storm of things going wrong, but if you were 70% stocks, 15% KMLM, and 15% RSBT, your returns were +1.1%.
- The importance of diversification.
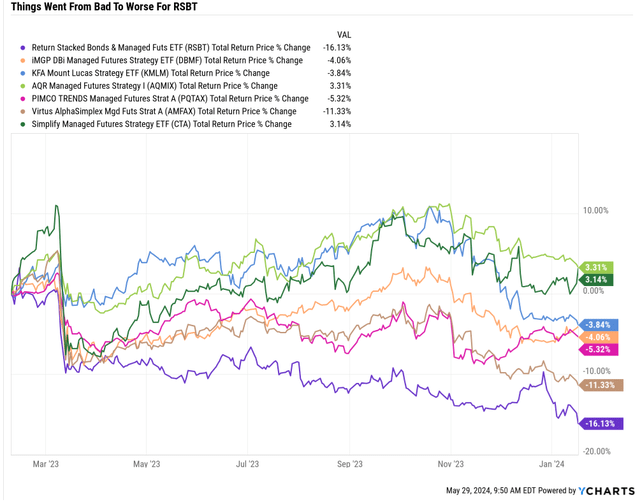
Ycharts
RSBT struggled as bonds were hammered for most of 2023. The rate peak in October saw the ETF continue to fall, bottoming on Jan. 17, 2024.
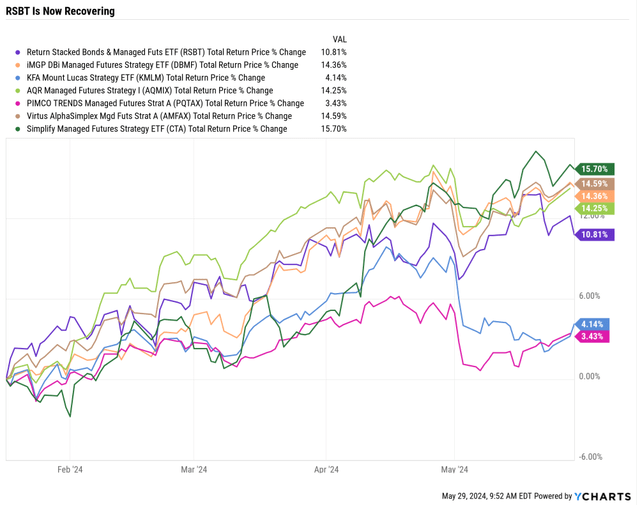
Ycharts
RSBT is recovering from its lows, up an excellent 11%, the same as the S&P for the year. However, that's lagging behind some trend-following peers because bonds have struggled with the "higher for longer" rate environment.
Leverage Risk: RSBT uses leverage, which controls more assets than cash. This can amplify gains but also losses. RSBT isn't going to get a margin call. It uses strong risk management protocols to ensure it doesn't get wiped out. However, leverage does mean that volatility can be higher than the underlying assets. For example, bond volatility is 3% yearly, and managed futures are about 14% long-term. Yet the peak decline of the RSBT strategy since 2000 was a 20% decline.
Corey Hoffstein
In other words, the 17% peak decline RSBT has suffered thus far is well within its historical norms, especially given that it was facing the perfect storm of everything going wrong at once and at the beginning of the ETF.
Strategy Risk: The managed futures trading models may not always work as expected, leading to underperformance.
This means tracking error is a risk. Remember, the historical data we've seen is based on the Soc Gen Trend index and the bond market.
However, RSBT is attempting to replicate their index, and verifying how well their algorithm works will take time.
| Since January 17th, 2024 (Bottom) | Total Return |
| RSBT | 10.81% |
| Soc Gen Trend Index | 12.61% |
| Barclay's Agg (Bonds) | -1.10% |
| Expected Return | 11.51% |
| Tracking Error | -0.70% |
| Since February 7th, 2023 Inception | |
| RSBT | -7.06% |
| Soc Gen Trend Index | 10.44% |
| Barclay's Agg (Bonds) | 0.67% |
| Expected Return | 11.11% |
| Tracking Error | -18.17% |
(Source: Ycharts, Soc Gen)
This is why I'm very gradually building my RSBT position. The tracking error since inception is very high, though since the perfect storm of everything going wrong, the returns you'd expect have been delivered.
Remember, some borrowing costs are involved, so the actual tracking error is less than 0.7% or 6%. So RSBT is currently running at 94% as designed, though when it launched, the chaos in future markets caused some painful losses.
Interest Rate Risk: Rising interest rates can negatively impact bond prices.
Interest rates change the profitability of stacking. Remember, the cost of borrowing is T-bills + 0.4% (long-term average).
That means that the stacked returns can sometimes be small or even slightly negative even if a strategy is profitable, like trend is over time.
For example. From 2010 to 2019, the trend index delivered 1.6% annual returns. At the same time, the borrowing cost was 0.6% (T-bills) + 0.4% or 1%.
- 1.6% return = 1% borrowing cost = 0.6% excess return - 1% expense ratio = - 0.4% excess return.
In other words, low rates tend to generate terrible conditions for trend following, and even though borrowing costs are 1%, the actual hurdle rate for investors to profit from is always 1.4% + the risk-free rate (currently 5.3%).
In other words, for RSBT to beat bonds right now, the trend must generate at least 6.7% annual returns.
Anything above that is added to the returns of bonds.
In the long term, the bond market consensus is 4% Fed funds rates, which would mean a 5.4% hurdle rate for the trend index for RSBT investors to see a total return benefit from the stacking of the strategies.
That means RSBT's long-term total returns could be only 1% above bond yields or 5%.
The diversification benefits are always present, though sometimes bonds and managed futures can be highly correlated, as we saw in March 2003.
So, while the strategy's historical return/yield is 7.4%, it might be 5% in the future. That's still better than bonds, but it's a risk to keep in mind.
Taxes:
Bonds and managed futures all pay 100% of their returns as yield over the long term. Bonds are taxed as ordinary income at your highest marginal tax rate.
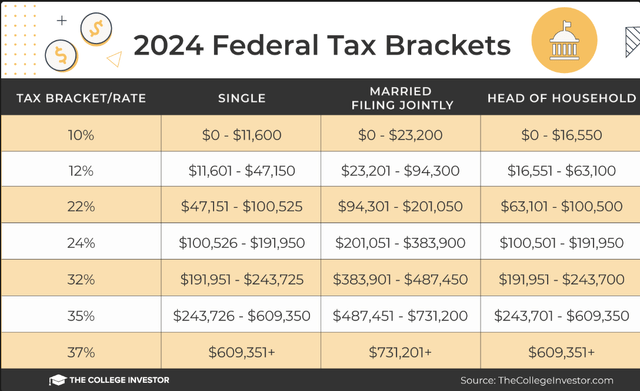
College Investor
Futures are taxed 2/3 long-term and 1/3rd short-term, preferential tax treatment.
ETFs are more tax-efficient than mutual funds, which is working in RSBT's favor.
| Managed Futures Fund | Annualized Return Since Inception | Post Tax Return | Tax-Expense Ratio | % Of Profits To Taxes |
| KMLM (ETF) | 12.81% | 10.58% | 2.23% | 17% |
| DBMF (ETF) | 10.20% | 8.28% | 1.92% | 19% |
| CTA (ETF) | 11.77% | 8.77% | 3.00% | 25% |
| AMFAX (mutual fund) | 5.30% | 3.05% | 2.25% | 42% |
| PQTAX (mutual fund) | 4.95% | 2.78% | 2.17% | 44% |
| AQMIX (mutual fund) | 3.94% | 1.94% | 2.00% | 51% |
| Average | 8.16% | 5.90% | 2.26% | 33.13% |
(Source: Morningstar) Bold = ETFs, and non-bold = actively managed funds.
The average managed futures ETF that uses a passive strategy (tracking an index) like KMLM or DBMF has about a 20% tax rate, while actively managed funds can be 40% to 50%.
For most investors, a 30% estimated tax rate on RSBT is likely close to the long-term average you'll face, so consider owning it in a tax-advantaged account like an IRA or Roth.
OK, given how complex RSBT is, the risk profile, and the terrible start the ETF has had, why am I willing to start building a position over time?
The Science-Based Magic And Asset Allocation Fueled Sorcery of Diversification
Ray Dalio calls diversification the "holy grail" of investing, and here's why. You can achieve market-like returns with five times less volatility and enough non-correlated assets.
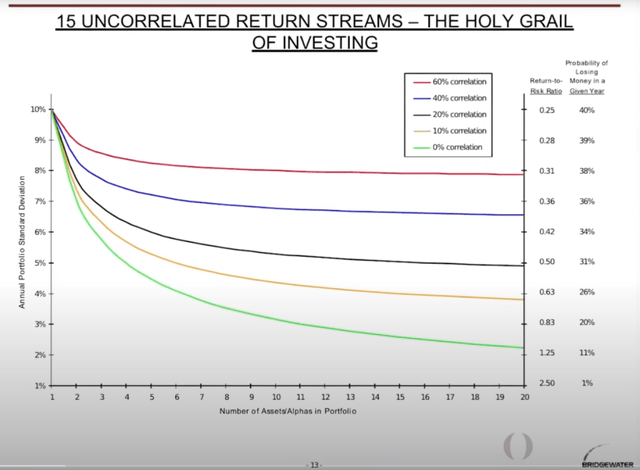
Bridgewater
Ray Dalio has dedicated his career to minimizing volatility and harnessing the power of diversification, famously known as "the only free lunch" on Wall Street.
Dalio, a hedge fund legend, aims for 15 to 20 non-correlated investment strategies—something most investors can't and shouldn't try to replicate simply because it isn't available in a low-cost and tax-efficient format, such as ETFs.
Just A Few Key Asset Classes Can Transform Your Portfolio Return And Risk Profile
Diversification, done well, is indistinguishable from magic." - Rodrigo Gordillo, Resolve Asset Management
Let me show you something incredible.
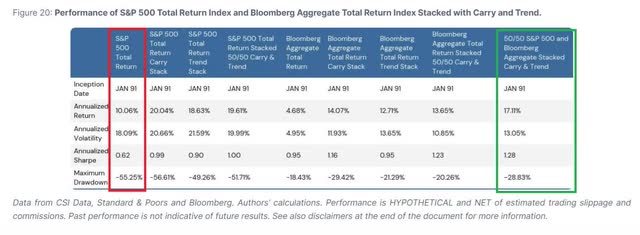
Resolve Asset Management
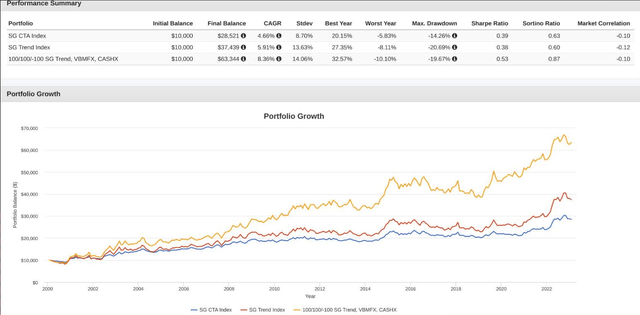
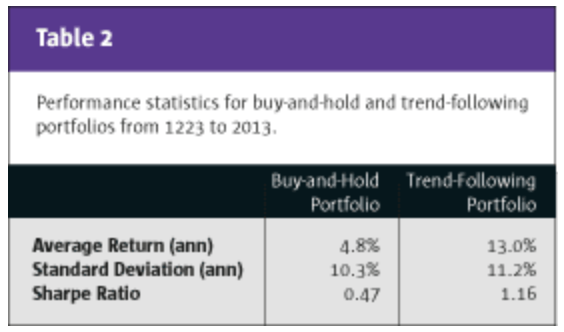
Over the last 33 years, a 50/50 stock and bond portfolio, stacked with 50% trend following managed futures and 50% carry (yield futures), delivered 17% annual returns.
That's a 183X return since 1991, compared to the S&P's 22X. Achieved with 30% less annual volatility. A smoother ride and 8X higher returns over time. And a 50% smaller decline during the Great Recession.
In a future article, I'll showcase the four ETF combos that can replicate this strategy (though actual returns can't be guaranteed). Two of those ETFs are launching soon, so it will likely be a few weeks or months before I can do that article.
But let me also show you other portfolio designs using similar return stacking of non-correlated asset classes over time.
Resolve Asset Management
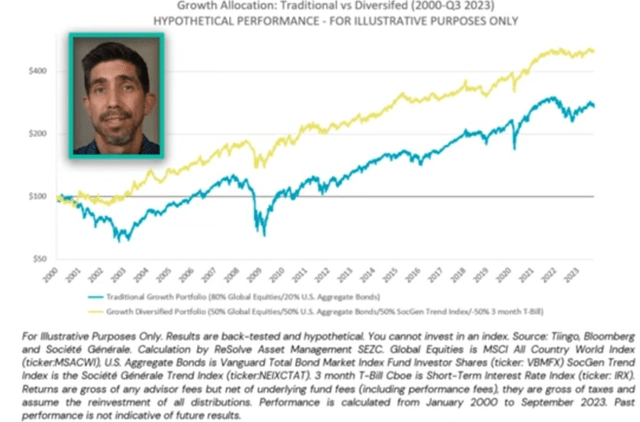
An 80/20 stock/bond portfolio is quite aggressive for most investors. However, the results are remarkable if you opt for a more balanced approach with a 50% stock/50% bond portfolio and then stack 50% trend-following futures. Since 2000:
80/20 global stock/bond portfolio: 4.3% annual returns (150% total return).
50/50 global stock/bond with 50% trend-following: 6.8% annual returns (225% total returns).
A 50/50 stock/bond portfolio stacked with 50% trend-following not only beats an 80% stock portfolio over a quarter century, but it does so with far less volatility and much smaller peak declines during bear markets. Now, that's what I call financial science-based magic and diversification-fueled sorcery.
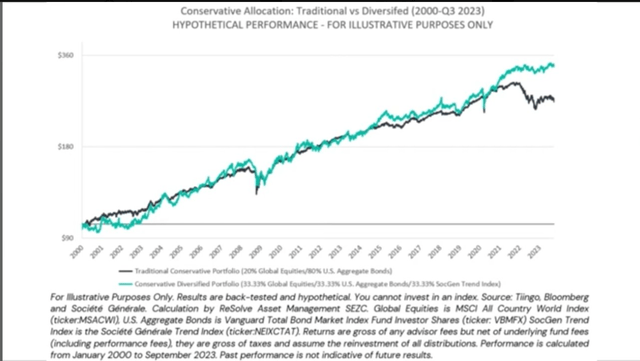
What About More Conservative Portfolios?
Let's talk about conservative portfolios. A 50/50 stock/bond mix is pretty conservative, aligning with the equity allocation of many cautious financial institutions.
Public Pension Funds:
- Public Equities: 47.1%
- Fixed Income: 21.2%
- Real Estate: 6.8%
- Alternative Investments: 22.6%
- Cash & Other: 2.5%
Fortune 1000 Pension Plans:
- Public Equity: 30.3%
- Debt (Fixed Income): 54.8%
- Alternative Assets: The remaining portion comprises real estate, private equity, and other alternatives.
OECD Countries:
- Bonds and Equities: These two asset classes account for more than half of investments in most OECD countries.
- In the United States, 55.4% of pension assets are in bonds and equities, and 44.6% are in alternatives.
Endowments:
General Endowment Funds:
- Public Equities: 57.7%
- Private Investments: 23.8%
- Real Assets: 7.7%
- Multi-Asset Credit: 5.9%
Top US Endowments (e.g., Harvard and Yale):
- Equities and Bonds: 56% of the portfolio
- Alternative Assets: 44%, including private equity, hedge funds, and other alternatives
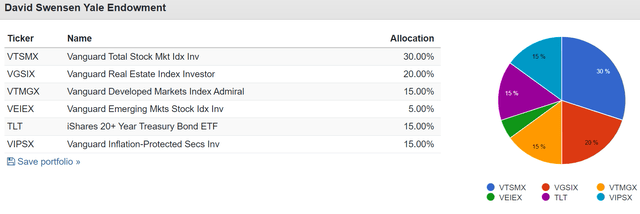
Yale Endowment (Since 2002)
Portfolio Visualizer Premium
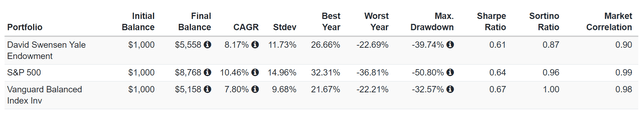
Portfolio Visualizer Premium
Summary of Conservative Asset Allocators:
Pensions: On average, public pension funds allocate around 47.1% to stocks and 21.2% to bonds. Fortune 1000 pension plans allocate about 30.3% to public equity and 54.8% to debt.
Endowments: Endowments typically allocate more to alternative investments. For instance, a general endowment fund might allocate 57.7% to public equities and 23.8% to private investments, with a smaller portion in bonds.
But remember, conservative institutions also allocate significantly to alternative assets and strategies to diversify away from just bonds and stocks. Diversification is critical to managing risk and achieving more stable returns over time.
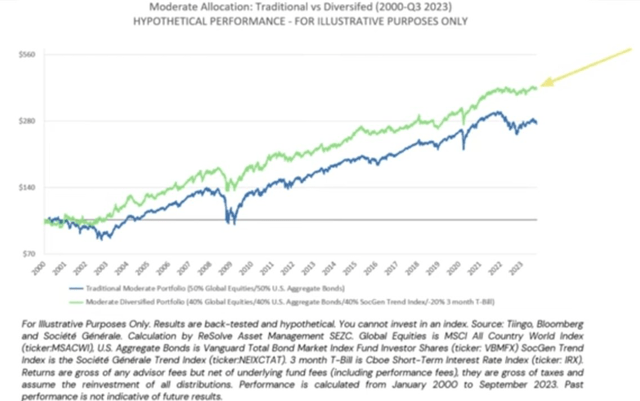
Resolve Asset Management
This is the power of return stacking non-correlated assets using futures.
A 40% stock, 40% bond, and 40% managed futures portfolio outperformed a 50/50 stock/bond portfolio by 320% total returns vs 180% over 23 years.
Resolve Asset Management
Smoother returns, higher returns, and smaller declines in bear markets that allow you to sleep well at night are the "holy grail" that Ray Dalio is talking about.
How I'm Considering Applying Return Stacking To My Portfolio
Here's a potential alternative to my current portfolio design.
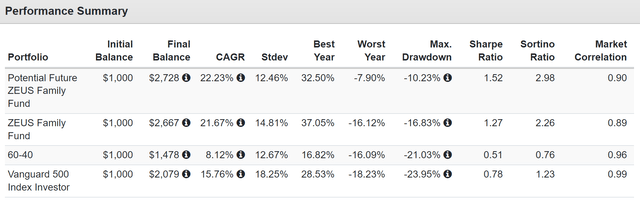
I've been studying this potential strategy for two weeks and discovered that I can significantly improve the volatility-adjusted returns of my portfolio design. This includes maintaining the same high level of returns while reducing volatility, cutting the peak decline of the most recent bear market almost in half.
Potential Future ZEUS Family Fund.
| Stock | Yield | Growth | Total Return | Weighting | Weighted Yield | Weighted Growth | Weighted Return |
| VFLO | 1.0% | 16.6% | 17.6% | 17.5% | 0.2% | 2.9% | 3.1% |
| IWY | 0.7% | 15.3% | 16.0% | 17.5% | 0.1% | 2.7% | 2.8% |
| RSBT | 7.4% | 0.0% | 7.1% | 15% | 0.8% | 0.0% | 0.8% |
| KMLM | 8.1% | 0.0% | 8.1% | 15% | 1.2% | 0.0% | 1.2% |
| BTI | 9.7% | 8.7% | 18.4% | 8.75% | 0.8% | 0.8% | 1.6% |
| AMZN | 0.0% | 25.3% | 25.3% | 8.75% | 0.0% | 2.2% | 2.2% |
| BAM | 3.8% | 15.7% | 19.5% | 8.75% | 0.3% | 1.4% | 1.7% |
| NVDA | 0.1% | 32.7% | 32.8% | 8.75% | 0.0% | 2.9% | 2.9% |
| Total | 100.00% | 3.80% | 12.78% | 16.59% |
(Source: FactSet Research Terminal)
Based on the FactSet consensus and historical yields of these hedging strategies, this would slightly boost my portfolio's yield by 0.5% and the long-term expected return.
Since June 2019
Since June 2019 (Portfolio Visualizer )
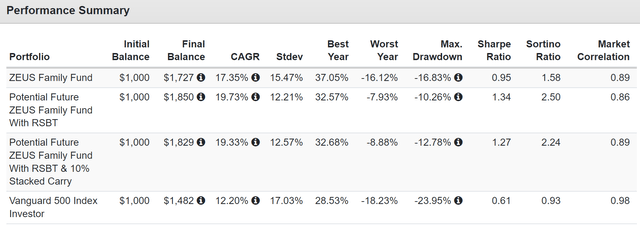
The alternative portfolio has a slightly higher yield than my current design, better Fact-Set long-term consensus total return potential, and far lower volatility. The higher return isn't surprising, as NVDA has done exceptionally well during this time, and this potential alternative portfolio design is more concentrated into my four highest conviction ideas.
However, NVDA is also extremely volatile, so a higher concentration of NVDA (about 10%, including ETFs) would make you think it would be more volatile, not less so.
Portfolio Visualizer Premium
Portfolio Visualizer Premium
This potential alternative portfolio has 25% invested into three high-volatility stocks: NVDA, AMZN, and BAM. Yet its historical volatility is equal to 60-40, and with peak declines in bear markets, that's 2X smaller declines than a 60-40 and 3X smaller declines than the S&P.
Beating the S&P with 33% less annual volatility (smoother returns) and 3X smaller peak declines in bear markets (less withdrawal risk if you need money). That is the power of return stacking to increase diversification without sacrificing returns.
Portfolio Visualizer Premium
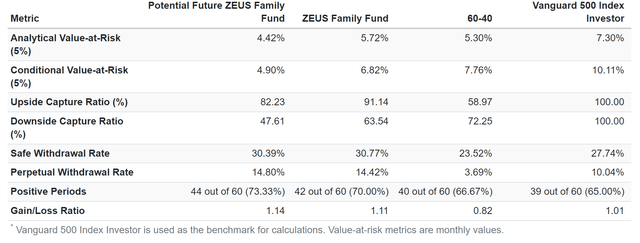
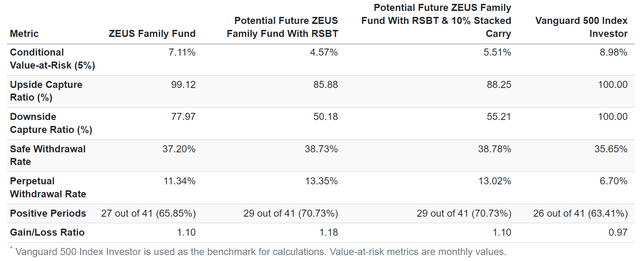
The new design captures 82% of the market's upside in good times and just 48% of the downside. Giving up 9% upside in exchange for 17% smaller downside? That's a good deal.
Conditional value at risk means "in a market panic, how bad can monthly returns get?" Sub 5% CVAR is less than half that of the S&P and better than my current portfolio.
The long-term, perpetual withdrawal rate remains the same, and the periods of months that are positive rise to 73% over the last five years, superior to the S&P's 65%.
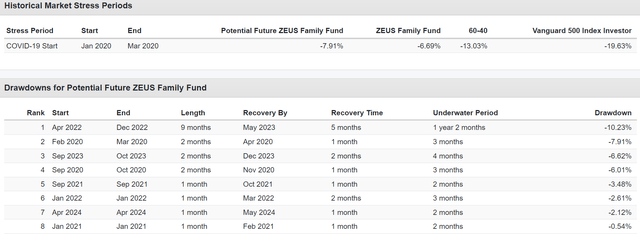
2020 Pandemic Bear Market
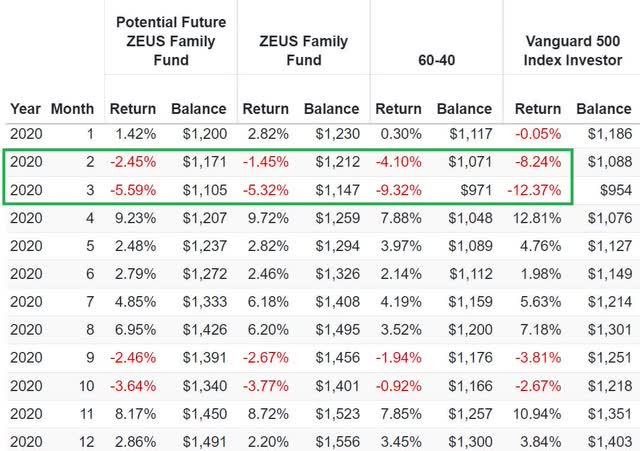
Portfolio Visualizer
2022 Bear Market
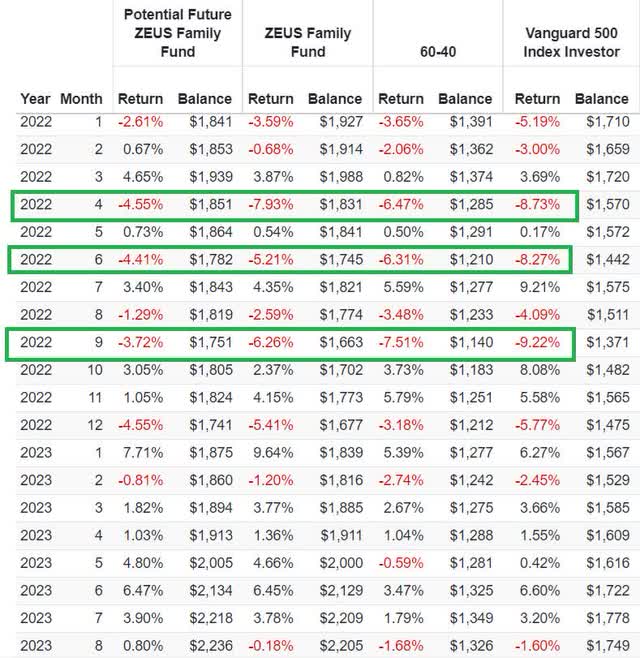
Portfolio Visualizer
A lot more inflation protection. And here's why.
The Secret To This Improved Diversification
Even though I'm potentially looking to streamline my portfolio significantly, optimizing my hedging bucket actually improves diversification.
Asset allocation diversification ultimately drives 87% of returns, which matters most.
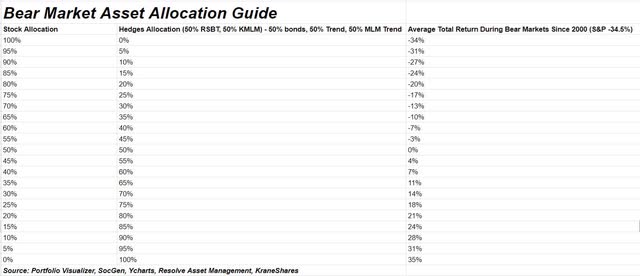
Hedging Strategy Tournament
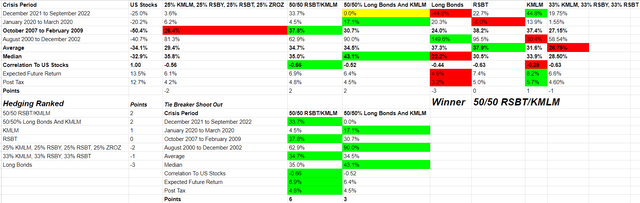
DK S&P Valuation Tool
Here are various combinations of hedging assets, including long bonds, KMLM, RSBT, the upcoming RSBY (bonds + futures yield), and various combinations.
We have historical data about how these hedging buckets performed during the four worst bear markets of the last 33 years.
- 2022: inflation shock, fast bear market.
- 2020: Black Swan, fastest 30+% decline in history.
- 2008: Liquidity crunch, 2nd largest market crash in history.
- 2000: Longest (37 months of stock declines) and deep, 50% decline, bubble induced.
Inflation shocks, liquidity crises, fast, slow, long, short, these four bear markets are an excellent survey of the kinds of bear markets throughout history.
Green color coding means the best performer in that bear market or metric. To which I assign 1 point.
Red is the worst performer, and I detract one point.
Then, I added up all the points and ranked each strategy.
When 50/50 ZROZ/KMLM (long bonds and managed futures), my current strategy ties with RSBT, we have a tiebreaker, head-to-head comparison, and RSBT wins 6 to 3.
Both strategies are excellent, but RSBT provides equally strong hedging in bear markets, with greater negative correlation (hedging power) in regular corrections, and has higher expected returns both pre- and after-tax.
Combining KMLM with RSBT creates a far better historical hedging strategy than my current KMLM/ZROZ combination. It also has a slightly higher expected return both pre- and post-tax. The post-tax return is 1% higher than ZROZ's long-term expected pre-tax return.
One Final Optimization Confirmation
While the carry trade ETFs from Return Stacked aren't out yet, iShares Commodity Cure Carry Strategy ETF (CCRV) has been around since January 2021 and can give us an idea of how adding this 4th asset class would have altered the portfolio's returns.
- Hedging Bucket of 10% KMLM.
- 10% RSBT strategy (10% bonds, 10% trend).
- 10% Carry ETF
Since January 2021
Portfolio Visualizer
In these three years, the volatility was lower than my current portfolio design, with superior returns and much smaller peak declines. The negative volatility-adjusted returns (Sortino) are much better as well.
Portfolio Visualizer
Superior upside/downside capture ratio:
- Current portfolio: 1.27
- Potential design with RSBT: 1.72
- Potential design + carry: 1.6
- S&P: 1.0
Note that the perpetual withdrawal rates are higher due to the smoother returns.
2022 Inflation Shock Bear Market
Portfolio Visualizer
Remember that this potential portfolio is 25% AMZN, NVDA, and BAM, three high-volatility stocks. It's also 18% IWY, which got crushed in the 2022 bear market.
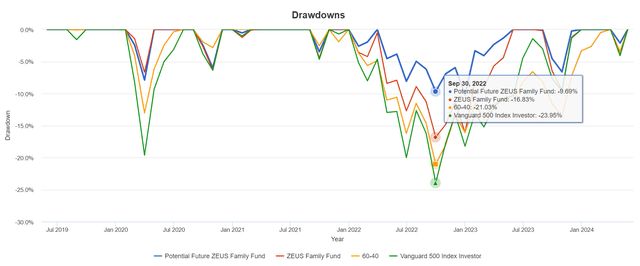
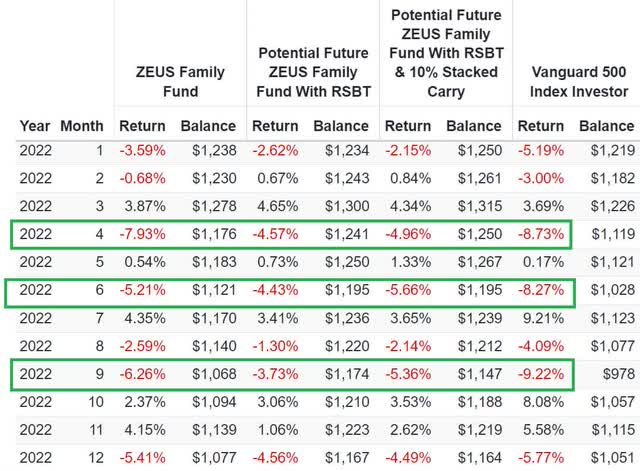
That's 43% of the portfolio slammed in 2022's inflation shock. And yet when the market fell 9% in September of 2022, the worst monthly return of the crisis, the new design fell just 3.7%, a 2.5X smaller decline.
Worst Months Of 2022 Inflation Shock Bear Market
| Month | Current ZEUS Family Fund | Potential ZEUS Family Fund With RSBT | S&P 500 | Current Portfolio Decline % Of Market Decline (Crisis Beta) | Potential Portfolio Decline % Of Market Decline (Crisis Beta) |
| April | -7.93% | -4.57% | -8.73% | 91% | 52% |
| June | -5.21% | -4.43% | -8.27% | 63% | 54% |
| September | -6.26% | -3.73% | -9.22% | 68% | 40% |
| Average | -6.47% | -4.24% | -8.74% | 74% | 49% |
45% of the portfolio is high volatility, yet because the 30% hedging bucket represents 45% hedging (15% bonds, 15% trend, 15% MLM trend), the peak declines in the worst market months in a bear market are 50% smaller.
This is the bar-bell approach to investing. High-return assets are perfectly balanced with negatively correlated hedges.
So, there you have it, the proof that return stacking is a powerful potential strategy to increase diversification, boost returns, reduce volatility, and slash volatility even if you own a lot of high-volatility stocks.
Bottom Line: Why I'm About To Start Buying This 7.4% Yielding ETF
As you can see, there's much to like about RSBT and the concept of return stacking.
A 30% hedging allocation can become 45%, using low-cost leverage that retail investors could not achieve independently. And through stacking non-correlated assets, you can boost returns, reduce volatility, and slash peak declines in bear markets.
In other words, a better sleep-well-at-night portfolio without sacrificing returns. As Ray Dalio says, diversification is the holy grail.
And there's one other reason to be optimistic about future returns of trend following.
Why I Am Bullish On Trend Following Managed Futures In The Future
AlphaSimplex Study (Hedge Fund Journal )
The historical returns from trends following globally have been 13%, according to research from AlphaSimplex.
Alpha Architect
Alpha Architect
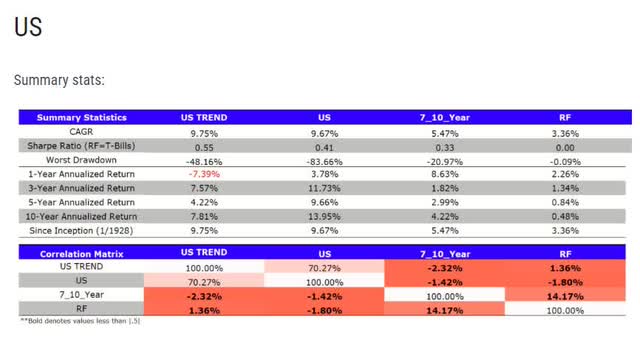
The historical returns for the US trend following since 1928 is 9.75%, basically matching the stock market.
KraneShares
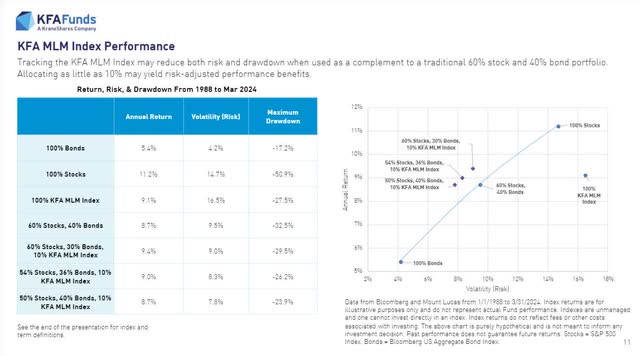
Since 1988, the Mount Lucas trend-following index delivered 9.1%, which is very similar.
From 2000 to 2009, before interest rates went to zero for 15 years, the Soc Gen Trend index compounded at 11.3% CAGR.
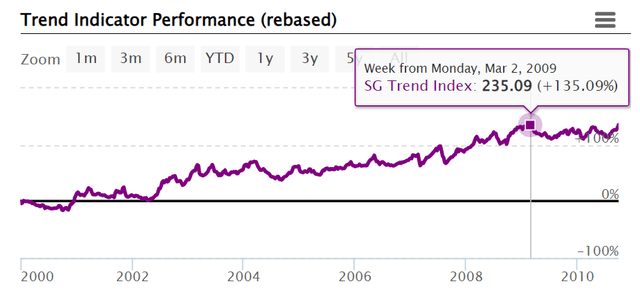
Soc Gen
What Kind Of Returns Might Trend Following Allow To Be "Stacked" On Top Of Bonds or Stocks?
| Time Frame | Total Return |
| Since 1223 (AlphaSimplex) | 13.0% |
| 1928 (Alpha Architect) | 9.7% |
| 1988 (Mount Lucas) | 9.1% |
| 2000 to 2009 (Soc Gen) | 11.3% |
| 2009 to 2019 (Soc Gen) | 1.3% |
| 2020 to 2024 (Soc Gen) | 12.2% |
| Average Return (All Periods) | 9.4% |
| Long-Term Borrowing Costs (T-Bill + 0.4%) | 4.4% |
| Expense Ratio | 1.0% |
| Excess Stacked Return Potential From Trend | 4.1% |
| Potential Long-Term Return On RSBT | 8.1% |
| Potential Long-Term Return On RSST | 17.6% |
| Post-Tax Potential Long-Term Return On RSBT | 5.6% |
| Post-Tax Potential Long-Term Return On RSST | 12.3% |
(Source: FactSet Research, Soc Gen, Mount Lucas, Alpha Architect, Alphasimplex)
I plan to start buying RSBT over time.
- 25% of future buys into RSBT (until 30% hedging allocation is achieved)
- 25% into KMLM (until 15% target allocation)
- 50% highest conviction stocks/ETFs
Remember to size any ETF or stock position based on your personal risk profile, and remember that asset allocation is all about long-term thinking.
In the short term? Trend following sucked for an entire decade when rates were zero.
Now that the world is back to normal, it will most likely start working as it has for the last 800 years, but it might not be in any given period.
But as Buffett said,
The stock market is designed to transfer money from the active to the patient." - Warren Buffett
Disclaimer: Investing carries risk. This is not financial advice. The above content should not be regarded as an offer, recommendation, or solicitation on acquiring or disposing of any financial products, any associated discussions, comments, or posts by author or other users should not be considered as such either. It is solely for general information purpose only, which does not consider your own investment objectives, financial situations or needs. TTM assumes no responsibility or warranty for the accuracy and completeness of the information, investors should do their own research and may seek professional advice before investing.
Most Discussed
- 1
- 2
- 3
- 4
- 5
- 6
- 7
- 8
- 9
- 10