YYY: Long-Term Decay And Excessive Expense Ratio
D-Keine/iStock via Getty Images
Since my first sell rating on Amplify High Income ETF (NYSEARCA:YYY) in February 2021, its share price is down -27% and its total return is +9% (before tax on distributions), while the S&P 500 index has gained 42%. Although YYY has performed decently in the last 10 months, this article renews my long-term negative opinion in the light of updated data.
YYY strategy
Amplify High Income ETF (YYY) is a high-yield fund that launched on 6/21/2013 tracking the ISE High Income Index. It has a portfolio of 60 closed-end funds (CEFs), a distribution rate of 11.85% and a 30-day SEC yield of 10.45%. The expense ratio is extremely high, even compared with other funds of funds: 0.50% in management fees plus 4.10% in held fund expenses, totaling 4.60%! You must see it to believe it:
YYY fees on 9/6/24 (Amplify ETFs website)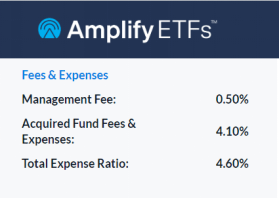
As described by Amplify ETFs, the underlying index:
selects CEFs ranked highest overall by ISE in the following factors: Yield, Discount to Net Asset Value (NAV), and Liquidity. This investment approach results in a portfolio which contains a variety of asset classes, investment strategies and asset managers.
Eligible funds must be listed in the U.S., have a capitalization of at least $500 million and an average daily trading volume of at least $1 million. They are ranked based on a score including 3 factors: yield, discount to NAV and liquidity. Constituents are selected and weighted based on their score, with some adjustments. The index is reconstituted twice a year, in January and July.
The fund changed names in 2019, keeping the same ticker and methodology. The methodology changed in July 2021: the number of holdings increased from 30 to 45, the constituent weight was capped at 3%, and the reconstitution became semi-annual (previously annual). It seems there was another modification in 2024, resulting in an inconsistency on Amplify ETFs website as of 9/6/2024: it reports a list of 60 holdings, while the index methodology document still claims that “the Index seeks to have 45 components, that number should be considered a maximum limit”. I don't like funds that change their methodologies: it may be a clue of failing strategy.
Portfolio
BlackRock is the heaviest fund sponsor in the portfolio (23% of asset value), followed by abrdn (15%) and Nuveen (14%). As of writing, YYY is diversified across asset classes: 59% of asset value is in bonds and 41% in stocks. These numbers may change over time. The heaviest subclass is senior loans, with 16% of assets. The top 10 holdings, listed in the next table, represent 32.2% of asset value, and the heaviest position weighs 3.92%. Therefore, the portfolio is well-diversified and risks related to individual funds are low to moderate.
TICKER | NAME | WEIGHT |
IGR | CBRE Global Real Estate Income Fund | 3.92% |
JQC | Nuveen Credit Strategies Income Fund | 3.28% |
WDI | 3.27% | |
MEGI | NYLI CBRE Global Infrastructure Megatrends Term Fund | 3.23% |
JFR | Nuveen Floating Rate Income Fund/Closed-end Fund | 3.17% |
FAX | 3.14% | |
HQH | abrdn Healthcare Investors | 3.10% |
BCAT | BlackRock Capital Allocation Term Trust | 3.06% |
ECAT | BlackRock ESG Capital Allocation Term Trust | 3.03% |
BMEZ | BlackRock Health Sciences Term Trust | 2.97% |
Closed-end funds are often chosen by investors for their high yields. They also have a few metrics that are not applicable to stocks and ETFs. Two of them are more important than the yield:
- Discount to NAV (higher is better);
- Relative discount = Discount to NAV minus its 12-month average (higher is better).
The latter is meaningful because the discount often shows a mean-reversion pattern. The next table compares these metrics in the full CEF universe and a sample of 37 holdings of YYY (excluding those for which my data provider doesn’t have all the information).
Aggregate discount % | Aggregate relative discount % | |
YYY Holdings (37) | 5.30 | -2.77 |
CEF universe | 6.18 | -2.39 |
Calculation with Portfolio123
This sample of holdings is a bit inferior to the CEF universe regarding these valuation metrics, so YYY valuation is likely slightly below-par.
Past performance
Since 7/1/2013, YYY has underperformed its largest competitor, Invesco CEF Income Composite ETF (PCEF). The next table also includes a benchmark of mine: a simulated portfolio of the 100 CEFs with higher yields among those with an average daily trading volume above $100,000 and a positive discount. It is reconstituted twice a year in equal weight to make it comparable to the underlying index.
Since 7/1/2013 | Total Return | Annual Return | Drawdown | Sharpe ratio | Volatility |
YYY | 58.58% | 4.21% | -42.52% | 0.26 | 13.92% |
PCEF | 90.08% | 5.91% | -38.64% | 0.42 | 12.51% |
My Benchmark | 123.91% | 7.47% | -42.88% | 0.46 | 15.03% |
Data calculated with Portfolio123
YYY underperforms in total return, and also in risk-adjusted performance (Sharpe ratio). However, it is marginally ahead of PCEF over the last 12 months:
YYY vs PCEF, 12-month total return (Seeking Alpha)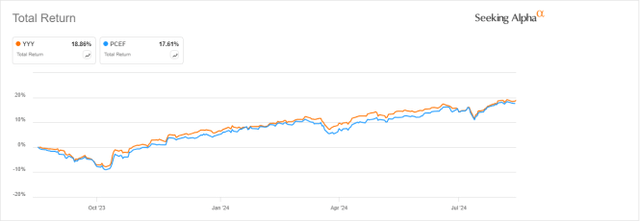
The annualized return, including distributions, is below the distribution rate’s historical average (which is over 8%). It means YYY paid high yields while it was suffering a decay in value. The next chart confirms it: the share price has lost 46% since 7/1/2013. Adding to the pain, the cumulative inflation in the same time was over 30%, based on CPI data. PCEF was a bit better at preserving capital, although a 20% loss isn’t pretty either.
YYY share price history (Seeking Alpha)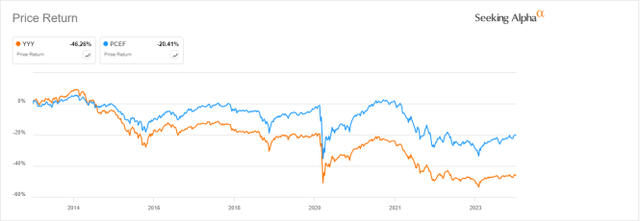
The distribution history isn’t more attractive. The annual sum of distributions decreased from $2.06 per share in 2014 to $1.44 in 2023. For shareholders, it’s a 30% loss of income stream in 9 years, while the cumulative inflation was about 30%.
YYY distribution history (Seeking Alpha)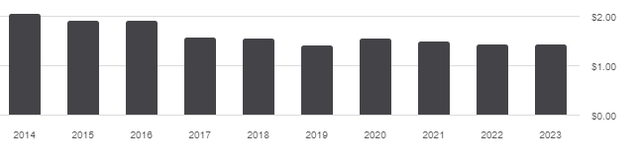
Takeaway
Amplify High Income ETF may be used in short-term trades to profit by some market anomalies. However, it has been a bad long-term investment since its inception in 2013, showing a significant decay in value and distribution. It is unlikely to suddenly become a winner. Anyway, its ridiculous expense ratio of 4.60% is sufficient reason to avoid it.
Disclaimer: Investing carries risk. This is not financial advice. The above content should not be regarded as an offer, recommendation, or solicitation on acquiring or disposing of any financial products, any associated discussions, comments, or posts by author or other users should not be considered as such either. It is solely for general information purpose only, which does not consider your own investment objectives, financial situations or needs. TTM assumes no responsibility or warranty for the accuracy and completeness of the information, investors should do their own research and may seek professional advice before investing.
Most Discussed
- 1
- 2
- 3
- 4
- 5
- 6
- 7
- 8
- 9
- 10