GSPY: Mirroring S&P 500 ETFs With A Higher Fee
ewastudio/iStock via Getty Images
The GSPY strategy
Gotham Enhanced 500 ETF (NYSEARCA:GSPY) is an actively managed ETF launched on 12/28/2020. It has 501 holdings and a net expense ratio of 0.50%. As described in the prospectus by Gotham ETFs, GSPY invests in the constituents of the S&P 500 Index (SP500), reweighted based on “a systematic, bottom-up, valuation approach.” The methodology involves a systematic fundamental analysis considering “recurring earnings, cash flows, capital efficiency, capital structure, and valuation.” Companies that do not conform to the methodology or have questionable financial reporting may be excluded. The fund is rebalanced daily to reflect earnings releases, price action, and “other new information.” The portfolio turnover rate was 134% in the most recent fiscal year. This article will use as a benchmark the parent index S&P 500, represented by SPDR S&P 500 ETF Trust (SPY).
The GSPY portfolio
About 85% of asset value is invested in large and mega-cap companies. Technology is the heaviest sector, with 28.1% of assets. Then, come financials (14.4%), communication services (12.3%) and consumer discretionary (11.5%). The sector breakdown is not much different from the benchmark, as plotted on the next chart. Compared to SPY, GSPY moderately overweights communication, and to a lesser extent, a few other sectors. It almost ignores low-weight sectors: materials, utilities and real estate.
GSPY sector breakdown (chart: author; data: Fidelity, iShares)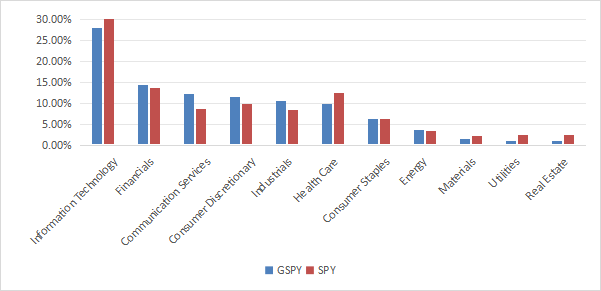
The top 10 holdings, listed below with fundamental ratios, represent 37.3% of asset value, while SPY has 34.8% of assets in its top 10 issuers (grouping the two share series of Alphabet, GOOGL and GOOG). The largest position weighs 7.38% in GSPY and 6.85% in SPY. Concentration and risks related to individual companies are similar in both funds. In fact, they share 8 of their top 10 issuers. The two top 10 companies of GSPY that are not in SPY’s top 10 are Visa and Johnson & Johnson. They weigh only 2.9% in aggregate. GSPY methodology doesn’t seem to revolutionize S&P 500 weights.
Ticker | Name | Weight | EPS growth %TTM | P/E TTM | P/E fwd | Yield% |
MSFT | Microsoft Corp. | 7.38% | 21.86 | 34.65 | 30.96 | 0.73 |
AAPL | Apple, Inc. | 6.84% | 10.38 | 33.63 | 32.95 | 0.45 |
NVDA | NVIDIA Corp. | 4.78% | 414.59 | 49.87 | 37.63 | 0.04 |
AMZN | Amazon.com, Inc. | 4.43% | 231.89 | 41.53 | 36.65 | 0 |
GOOGL | Alphabet, Inc. | 4.31% | 47.48 | 22.44 | 20.48 | 0.51 |
META | Meta Platforms, Inc. | 3.16% | 128.32 | 26.18 | 24.09 | 0.39 |
BRK.B | Berkshire Hathaway, Inc. | 2.09% | -21.04 | 15.22 | 23.75 | 0 |
V | Visa, Inc. | 1.57% | 18.89 | 30.47 | 28.28 | 0.74 |
JPM | JPMorgan Chase & Co. | 1.41% | 15.32 | 12.23 | 12.35 | 2.10 |
JNJ | Johnson & Johnson | 1.28% | 40.15 | 24.19 | 16.75 | 2.96 |
Fundamentals
GSPY is slightly cheaper than SPY regarding the price/earnings, price/sales and price/cash flow ratios, as reported in the next table. Price/book ratios are almost identical. As a whole, growth rates are not significantly different. Once again, GSPY characteristics don’t look very original relative to its parent index.
GSPY | SPY | |
Price/Earnings | 24.66 | 26.44 |
Price/Book | 4.63 | 4.62 |
Price/Sales | 2.56 | 3.03 |
Price/Cash Flow | 16.59 | 18.15 |
Earnings growth | 22.15% | 22.62% |
Sales growth | 8.75% | 8.79% |
Cash Flow growth | 9.78% | 8.99% |
Source: Fidelity.
Historical performance
Since its inception, GSPY has followed SPY very closely, as shown by the next chart. The two paths are nearly identical. Neither total return, nor risk (drawdowns and volatility) are materially different on any interval of the chart.
GSPY vs. SPY, since 1/1/2021 (Seeking Alpha)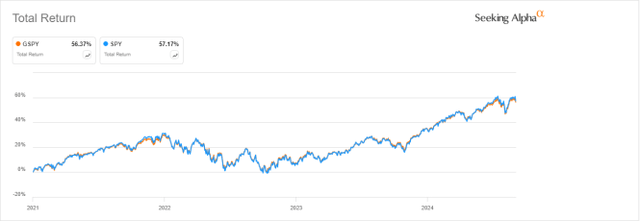
Over the last 12 months, GSPY is 1.56% behind SPY:
GSPY vs. SPY, 12-month return (Seeking Alpha)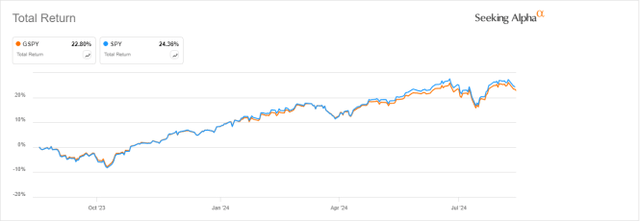
Takeaway
Gotham Enhanced 500 ETF invests in S&P 500 constituents, reweighted based on a proprietary valuation methodology. However, many of its characteristics are very close to the parent index: sector breakdown, top holdings, fundamentals, price action. The most notable differences are a higher expense ratio and an astounding 134% turnover rate. That’s much ado about nothing. GSPY's track record is still short, and we should give it a chance to make a difference. Meanwhile, there is no reason to buy a fund with a 0.50% net expense ratio and almost the same characteristics as capital-weighted S&P 500 ETFs, which start at a 0.02% fee with SPDR Portfolio S&P 500 ETF (SPLG).
Disclaimer: Investing carries risk. This is not financial advice. The above content should not be regarded as an offer, recommendation, or solicitation on acquiring or disposing of any financial products, any associated discussions, comments, or posts by author or other users should not be considered as such either. It is solely for general information purpose only, which does not consider your own investment objectives, financial situations or needs. TTM assumes no responsibility or warranty for the accuracy and completeness of the information, investors should do their own research and may seek professional advice before investing.
Most Discussed
- 1
- 2
- 3
- 4
- 5
- 6
- 7
- 8
- 9
- 10