BIZD: Revisiting The Fund's Three Largest Constituents
Klaus Vedfelt
It is high time to revisit one of the highest yielding sectors. Business development companies, abbreviated to BDCs, are high-yielding companies that specialize in the world of secured lending. Before diving deeper, let’s zoom out on what that really means.
BDCs are specialty lenders that serve as capital providers for companies that lie between small businesses and large corporations. These companies are generally too small to interface with large investment banks or issue traditional corporate bonds. This category is called “the middle market.” These companies can range in size, generally with annual revenue in the millions, not billions. These companies vary widely in terms of creditworthiness, size, and management.
Business development companies provide various forms of capital. This can range from traditional loans to revolving lines of credit. In rare cases, business development companies will also make equity investments in their clients.
The credit profile of a typical client of a business development company is generally too low to work with traditional lenders like banks. These companies may have small balance sheets, high leverage, or limited assets that would lead to an investment grade credit rating. For the lender, this means that these loans can be risky. Diversification and other risk management tools become paramount for BDC management.
However, the importance of diversification leads to another proposal entirely. Why not take an indexed approach to the sector? Invest in substantially all business development companies to spread around this risk and reduce company level exposure. This is the value proposition of the VanEck BDC Income ETF (NYSEARCA:BIZD), which tracks the MVIS US Business Development Company Index.
The purpose of this article is to revisit our prior thesis around BIZD which asserted that the fund’s largest constituents would outperform the broader indexed approach with consistency. This thesis was published nearly one year ago, so we will examine how the thought process unfolded.
Fund Overview
We cover BIZD on a recurring basis. Our past coverage of BIZD included comprehensive overviews of the fund and its underlying index. For that reason, our overview will be brief, focusing on current updates to the portfolio.
BIZD tracks the MVIS US Business Development Company Index, which is a market capitalization weighted index of public business development companies. The fund does not invest in any non-listed BDCs. This approach combined with a small sector means the portfolio is heavily concentrated towards the largest BDCs in the industry.
BIZD Fact Card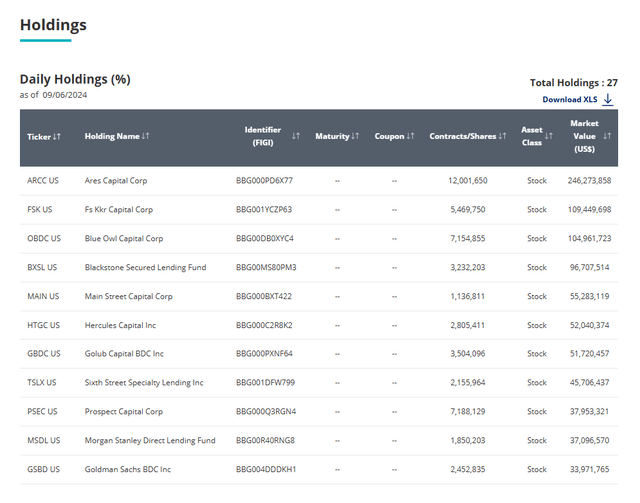
Currently, BIZD’s largest holdings are Ares Capital (ARCC) and FS KKR Capital Corp (FSK), the two largest business development companies by market capitalization. Over the past twelve months, ARCC has become a much larger piece of the index as the company grows. Together, these two investments account for more than 30% of BIZD’s assets, according to Seeking Alpha.
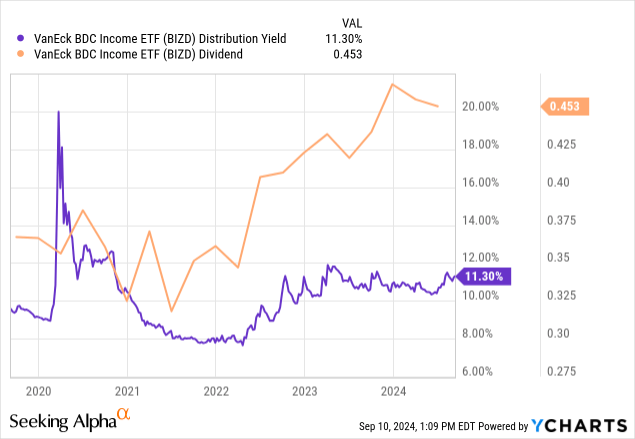
As consistent with companies in the BDC sector, BIZD pays a hefty distribution corresponding to nearly 12% based on current share prices. Over the past few years, the federal funds rate has increased, causing the secured overnight financing rate, or SOFR, to follow. Since most BDC loans are floating rate and tied to SOFR, this meant rising interest income for companies in the fund.
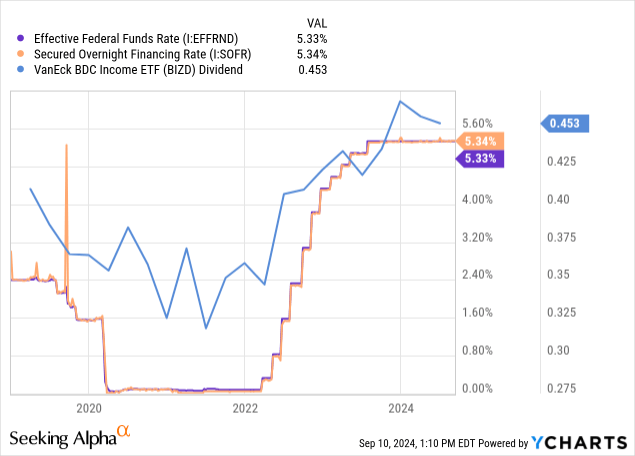
This rising income is subject to similar distribution rules to real estate investment trusts, meaning that most of this income must be distributed to shareholders. High-yielding loans combined with distribution requirements and rising interest rates means a high yield which has increased further.
Expense Analysis
One of the most common areas of question around BIZD is the fund’s management fee. Seeking Alpha quotes the fund’s expense ratio as 13.3%, which inevitably makes its way to the comment section from confused readers. VanEck clarifies the expense structure on their website, providing three components for the fund’s expenses. From left to right, we will break down the fund’s expenses.
BIZD Fact Card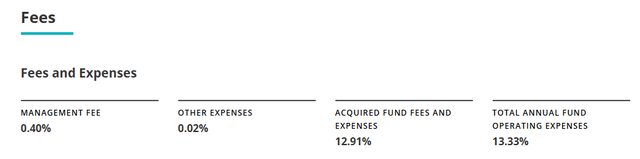
BIZD charges a management fee of 40 basis points of assets under management. This is high for an index fund like BIZD, which passively follows a market capitalization weighted index. However, it’s roughly half of the 75 basis point management fee charged by the actively managed fund from Putnam called the Putnam BDC Income ETF (PBDC).
The second component is a line item labeled “other expenses” charging two basis points. These are generally administrative expenses from the fund, which might include trading costs or offering costs.
Now comes the more complicated piece of the puzzle, which accounts for most of the expenses. VanEck lists an expense item called “Acquired Fund Fees and Expenses.” This category includes BIZD’s share of expenses charged by the underlying investments. Keep in mind, BIZD owns a portfolio of business development companies, most of which are externally managed. These typically have an advisory fee structure close to the traditional “2 & 20” approach, which includes a 2.0% management fee and a 20% incentive fee. These fees are calculated based on disclosures in the annual reports of the underlying funds. These fees are not collected by VanEck and are reflected in the performance of the individual companies.
For example, if you purchase shares of ARCC, you are paying fees to Ares Management (ARES) as an external advisor. ARCC uses a traditional fee structure based on a management fee and supplemental incentive fee. Looking deeper within ARCC’s annual report, we can understand the fee structure of BIZD’s largest holding. The expense structure of ARCC combines to a total annual expense greater than 16% when combining management fees, incentive fees, interest payments, and other line items.
ARCC SEC Filing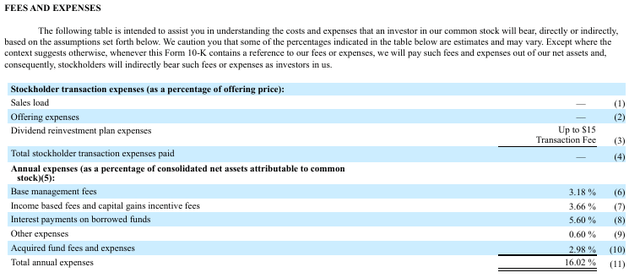
ARCC’s annual report provides details on the fund’s management fee structure and incentive fees. Interestingly, we will note that ARCC has its own share of acquired fund fees and expenses.
Our base management fee is calculated at an annual rate of 1.5% based on the average value of our total assets (other than cash or cash equivalents but including assets purchased with borrowed funds) at the end of the two most recently completed calendar quarters; provided, however, the base management fee is calculated at an annual rate of 1.0% on the average value of our total assets (other than cash or cash equivalents but including assets purchased with borrowed funds) that exceeds the product of (A) 200% and (B) our net asset value at the end of the most recently completed calendar quarter. The 3.18% reflected on the table is higher than 1.5% because it is calculated on our average net assets (rather than our average total assets) for the year ended December 31, 2023…
Income based fees are payable quarterly in arrears in an amount equal to 20% of our pre‑incentive fee net investment income (including interest that is accrued but not yet received in cash), subject to a 1.75% quarterly (7.0% annualized) hurdle rate and a “catch‑up” provision measured as of the end of each calendar quarter. Under this provision, in any calendar quarter, our investment adviser receives no income based fees until our net investment income equals the hurdle rate of 1.75% but then receives, as a “catch‑up,” 100% of our pre‑incentive fee net investment income with respect to that portion of such pre‑incentive fee net investment income, if any, that exceeds the hurdle rate but is less than 2.1875%. The effect of this provision is that, if pre‑incentive fee net investment income exceeds 2.1875% in any calendar quarter, our investment adviser will receive 20% of our pre‑incentive fee net investment income as if a hurdle rate did not apply.
Capital gains incentive fees are payable annually in arrears in an amount equal to 20% of our realized capital gains on a cumulative basis from inception through the end of the year, if any, computed net of all realized capital losses and unrealized capital depreciation on a cumulative basis, less the aggregate amount of capital gains incentive fees paid in all prior years
Now, circling back to BIZD, each share of ARCC held in the fund is paying its share of expenses to ARES as the external manager. This expense is being communicated on an overall basis through each holding’s respective internal expense structure. On the whole of BIZD, this amounts to a weighted average expense of 12.91% for the acquired fund fees and expenses. So the short answer is “Yes, BIZD’s expenses really are over 13%” but it is worth noting that this includes the blended expenses of each individual investments. For this reason, BIZD has drastically trailed the performance of its largest investments, as we are about to illustrate.
Review Of Prior Thesis
At the beginning of the year, we published an article on BIZD taking a critical look at the fund’s value proposition. More specifically, we looked at whether the diversification offered by BIZD was actually a dreaded case of “diworsification.” By including nearly every BDC, was BIZD unnecessarily exposing investors to poor quality companies that simply should not pass the test? The article was called “BIZD: Ditch This Fund And Buy Its Largest Constituents Instead” asserting that investors were better off buying shares of ARCC, FSK, and Blue Owl Capital (OBDC) instead. Our thesis boiled down to this statement:
Business development companies have unique drivers which determine their success, such as scale, relationships, and capital costs. First, larger BDCs have the scale necessary to mitigate risks and uncover operational competencies such as G&A efficiencies. These larger firms will also be able to work with a more diverse set of clients. Second, relationships are critical in the BDC sector. Blue chip competitors in the sector such as Ares Capital (ARCC) spent decades securing relationships across the middle market which ultimately built a strong portfolio. Finally, larger BDCs have superior capital costs via better credit ratings and the ability to issue equity at or above net asset value or NAV. These advantages are asymmetric and allow firms to differentiate themselves and refine their strategies.
These three reasons alone are sufficient to form a compelling investment thesis. Rather than diversifying across a concentrated sector with only 26 participants, investing in the top three constituents of the fund provides sufficient diversification while capitalizing on significant competitive advantages.
So, since the start of the year, how has this thesis panned out? Are the largest participants in the sector still outperforming the index? More importantly, as the macroeconomic outlook begins to shift for BDCs, are the largest constituents better prepared to face a falling interest rate environment?
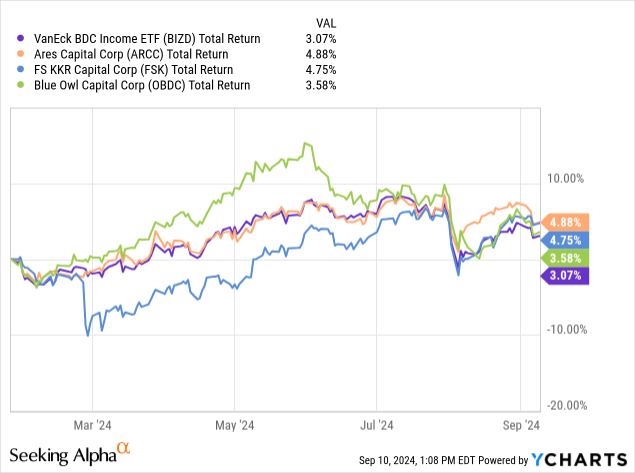
Since publication of our thesis article on BIZD, the fund’s three largest holdings have outperformed the ETF by a maximum margin of 1.7%. Now, stepping back, we must recognize that performance will be highly correlated since these investments account for around 40% of BIZD’s portfolio. However, the reality that the fund has underperformed these three indicates that the remaining 60% of assets and the fund’s management fee have created a net drag on the performance of the fund. Since the beginning of the year, these three large BDCs have outperformed the index. As illustrated in our previous article, this result also applies to longer time horizons.
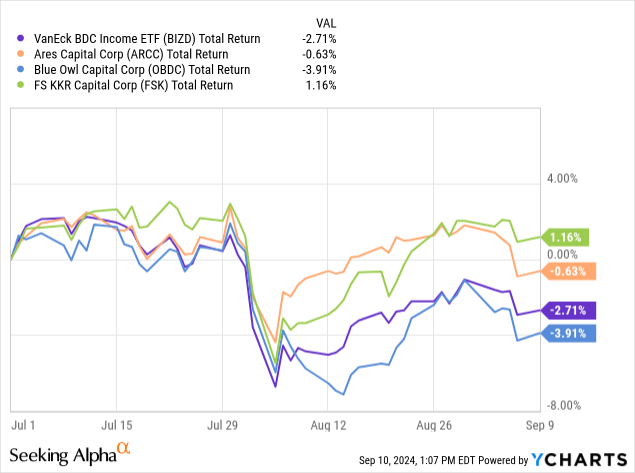
The sector reversal for BDCs began at the onset of Q3. As the Federal Reserve began to pivot, the outlook for BDCs changed similarly. Today, BDCs face a less enthusiastic investor crowd, as the likelihood that interest rates will go higher appears to be low. Since the beginning of July, two of the three largest holdings have outperformed BIZD by a margin of around 200 basis points. Only OBDC has trailed over the short-term period.
Conclusion
As interest rates begin to shift, we reiterate our primary thesis that investing in the fund’s three largest constituents, ARCC, FSK, and OBDC, present a superior opportunity as compared to investing in the entire sector. As this thesis continues to play out positively, we reiterate the belief that our original three factors provide a platform for BDC success.
With the current outlook, BIZD earns a Hold. The fund continues to distribute one of the highest yields in the investible universe, reaching nearly 12% based on current share prices. This is an opportunity that investors should not overlook, but the brightest period of BDCs has likely passed. In the meantime, considering the largest constituents of the index could be a superior approach as opposed to the fund of funds.
Disclaimer: Investing carries risk. This is not financial advice. The above content should not be regarded as an offer, recommendation, or solicitation on acquiring or disposing of any financial products, any associated discussions, comments, or posts by author or other users should not be considered as such either. It is solely for general information purpose only, which does not consider your own investment objectives, financial situations or needs. TTM assumes no responsibility or warranty for the accuracy and completeness of the information, investors should do their own research and may seek professional advice before investing.
Most Discussed
- 1
- 2
- 3
- 4
- 5
- 6
- 7
- 8
- 9
- 10