URTH: Improving Macroeconomic Environment Will Act As Tailwind
Richard Drury
ETF Overview
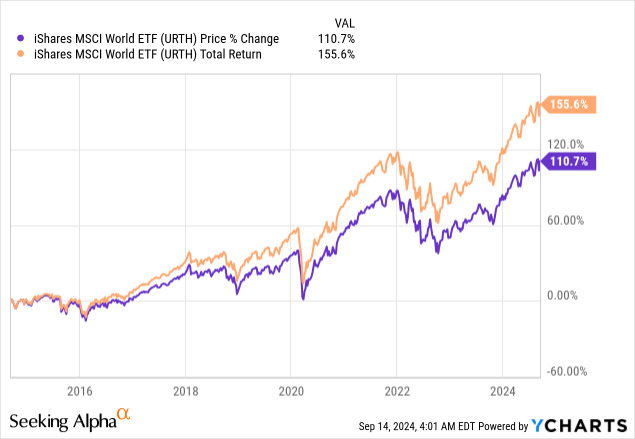
iShares MSCI World ETF (NYSEARCA:URTH) tracks the MSCI World Index and owns about 1,400 equities from developed countries around the globe. The fund has an expense ratio of 0.24%. This ratio is not cheap especially compare to many U.S. equities ETFs. However, given the need for URTH to manage a portfolio of international stocks, this ratio is acceptable. URTH’s growth outlook appears to be improving thanks to improving macroeconomic environment. In addition, its higher concentration to technology stocks is also beneficial for the fund in the long run. However, the fund’s valuation is not cheap nor too expensive. Therefore, we think any pullback will provide good opportunities for investors wanting some international exposure.
YCharts
Fund Analysis
A higher concentration of U.S. stocks
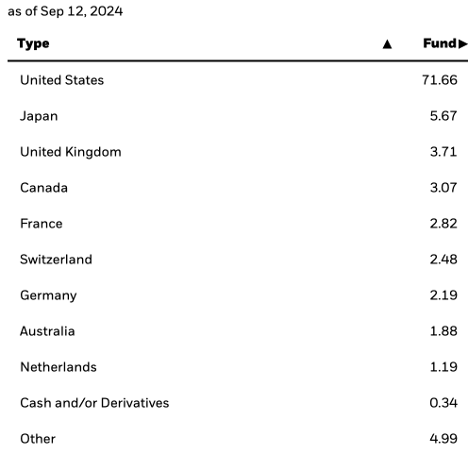
URTH has a portfolio of about 1,400 stocks. These stocks are selected from developed markets. As can be seen from the table below, over 70% of the portfolio are made up of stocks from the United States. These stocks include high profile names such as Apple (AAPL), Microsoft (MSFT), Nvidia (NVDA), Google (GOOG), Amazon (AMZN), etc. While some may argue that this high exposure to U.S. stocks may exhibit higher concentration risk, we think this exposure is actually beneficial. As we know, these high-profile U.S. stocks have good competitive advantages and have leading positions in their industry. In addition, they do not only derive their revenues and earnings domestically, a large chunk of their earnings and revenues are derived internationally. Therefore, these are “international” stocks with competitive positions.
iShares
Higher exposure to technology stocks
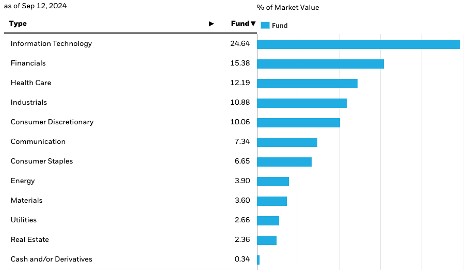
URTH’s portfolio of stocks come from a variety of sectors. As the chart below shows, except information technology sector which represents 24.6% of the total portfolio, all other sectors represent less than 20% of the total portfolio. Therefore, concentration risk is not high.
iShares
Although URTH’s exposure to information technology is nearly a quarter of the total portfolio, we like this exposure. As we know, information technology sector is a fast-growing sector and is riding on many technological megatrends that should ensure strong growth for URTH in the next few decades. These megatrends include artificial intelligence, cloud computing, AR/VR, Internet of Things (IoTs), industrial automation, etc. Therefore, average annual earnings growth rates of the sector in the long run is usually in mid-teens to high-teens (based on S&P 500 information technology sector past result).
Global economic outlook improving in 2025 and 2026
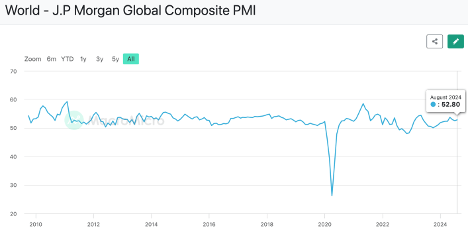
Let us evaluate URTH’s future growth outlook by checking the global composite PMI. For reader’s information, global composite PMI which consists of both services and manufacturing sectors, is a forward economic indicator that helps us to evaluate the strength of the global economy in the near future. A reading below 50 usually means the economy will likely contract at least in the next few months ahead. On the other hand, a reading above 50 usually means the economy is likely heading for expansion.
As the chart below illustrates, global PMI has been on a rising trend for two straight years since reaching the cyclical low in late 2023. The latest reading of 52.8 in August 2024 is a slight improvement from July’s 52.5 and much better than last year’s 50.6. Therefore, we think the global economy is heading for further expansion in 2025.
MacroMicro
This improving macroeconomic outlook is also in line with consensus earnings growth estimate for stocks in URTH’s portfolio. As can be seen from the chart below, 2024 earnings growth is expected to be 9.9%, much better than last year’s earnings growth rate of 0.35%. Even better than that is the consensus earnings growth forecast for URTH in 2025 and 2026, which are expected to reach 13.5% and 11.4% respectively. Therefore, we see URTH benefiting from better macroeconomic environment in 2025 and 2026.
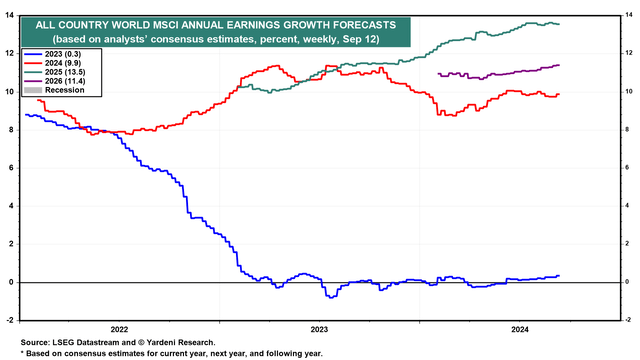
Yardeni Research
Higher valuation but not too expensive
URTH is currently trading at a forward P/E ratio of 17.2x. This ratio is slightly higher than the valuation range in 2018/2019 but still below the near-term peak of 20x reached in 2020/2021. Therefore, URTH’s valuation is not cheap, but not too expensive either.
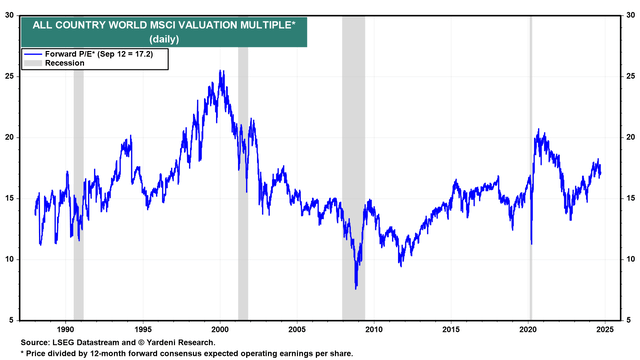
Yardeni Research
Risk to consider: Currency Risk
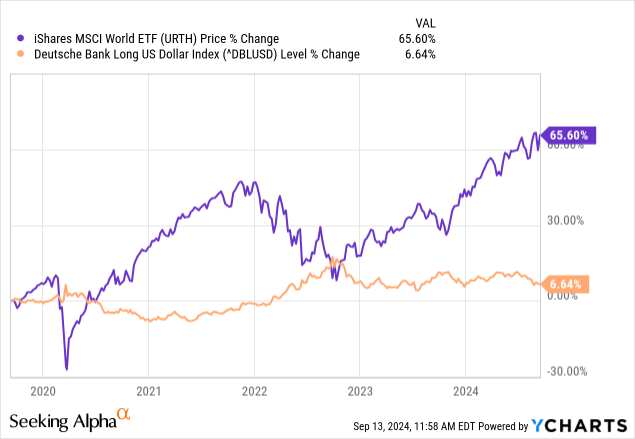
Since URTH includes stocks from around the globe, currency risk needs to be considered. As can be seen from the chart below, the strength and weakness of the U.S. dollar can cause URTH’s fund price to fluctuate, and they typically have an inverse correlation. Fortunately, as inflation cools off, the Federal Reserve is likely starting a new rate cut cycle. This will typically result in weaker U.S. dollar. A weaker U.S. dollar should also act as a catalyst to URTH’s fund price.
YCharts
Investor Takeaway
URTH will likely benefit from its exposure to technology stocks in the long run. Although URTH’s valuation is not cheap, but its growth outlook is improving. Therefore, we think any pullback will offer good opportunity especially for investors wanting more international exposure.
Additional Disclosure: This is not financial advice and that all financial investments carry risks. Investors are expected to seek financial advice from professionals before making any investment.
Disclaimer: Investing carries risk. This is not financial advice. The above content should not be regarded as an offer, recommendation, or solicitation on acquiring or disposing of any financial products, any associated discussions, comments, or posts by author or other users should not be considered as such either. It is solely for general information purpose only, which does not consider your own investment objectives, financial situations or needs. TTM assumes no responsibility or warranty for the accuracy and completeness of the information, investors should do their own research and may seek professional advice before investing.
Most Discussed
- 1
- 2
- 3
- 4
- 5
- 6
- 7
- 8
- 9
- 10