A fantastic week for Southwestern Energy Company's (NYSE:SWN) 89% institutional owners, one-year returns continue to impress
Key Insights
- Significantly high institutional ownership implies Southwestern Energy's stock price is sensitive to their trading actions
- 51% of the business is held by the top 13 shareholders
- Analyst forecasts along with ownership data serve to give a strong idea about prospects for a business
A look at the shareholders of Southwestern Energy Company (NYSE:SWN) can tell us which group is most powerful. The group holding the most number of shares in the company, around 89% to be precise, is institutions. In other words, the group stands to gain the most (or lose the most) from their investment into the company.
Last week’s 6.4% gain means that institutional investors were on the positive end of the spectrum even as the company has shown strong longer-term trends. One-year return to shareholders is currently 7.1% and last week’s gain was the icing on the cake.
In the chart below, we zoom in on the different ownership groups of Southwestern Energy.
Check out our latest analysis for Southwestern Energy
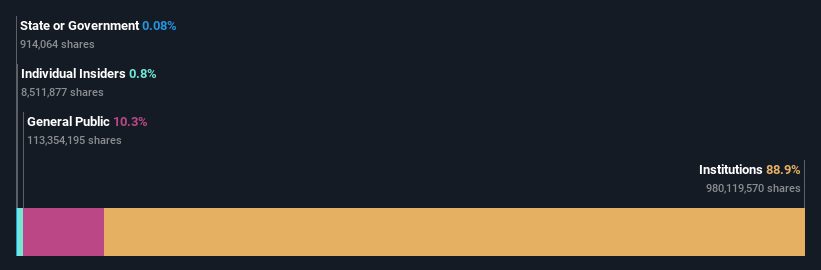
What Does The Institutional Ownership Tell Us About Southwestern Energy?
Institutions typically measure themselves against a benchmark when reporting to their own investors, so they often become more enthusiastic about a stock once it's included in a major index. We would expect most companies to have some institutions on the register, especially if they are growing.
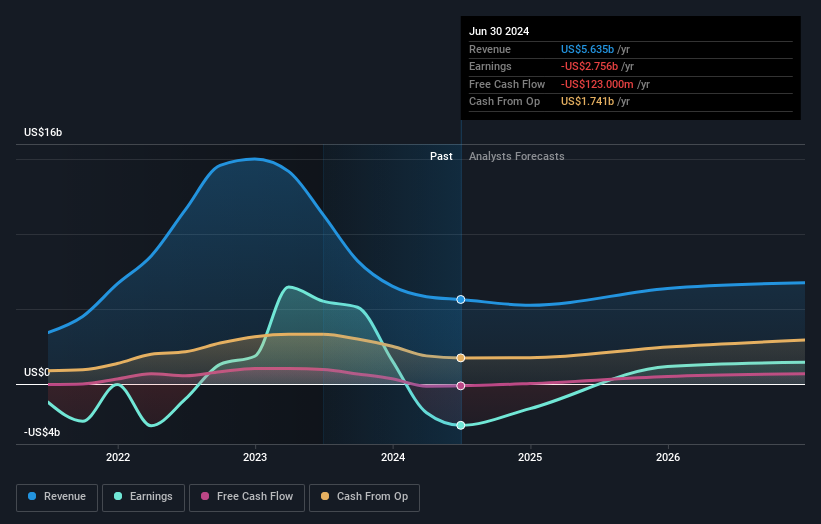
As you can see, institutional investors have a fair amount of stake in Southwestern Energy. This implies the analysts working for those institutions have looked at the stock and they like it. But just like anyone else, they could be wrong. When multiple institutions own a stock, there's always a risk that they are in a 'crowded trade'. When such a trade goes wrong, multiple parties may compete to sell stock fast. This risk is higher in a company without a history of growth. You can see Southwestern Energy's historic earnings and revenue below, but keep in mind there's always more to the story.
Institutional investors own over 50% of the company, so together than can probably strongly influence board decisions. Hedge funds don't have many shares in Southwestern Energy. Looking at our data, we can see that the largest shareholder is The Vanguard Group, Inc. with 10% of shares outstanding. With 8.8% and 6.9% of the shares outstanding respectively, BlackRock, Inc. and T. Rowe Price Group, Inc. are the second and third largest shareholders.
After doing some more digging, we found that the top 13 have the combined ownership of 51% in the company, suggesting that no single shareholder has significant control over the company.
While it makes sense to study institutional ownership data for a company, it also makes sense to study analyst sentiments to know which way the wind is blowing. Quite a few analysts cover the stock, so you could look into forecast growth quite easily.
Insider Ownership Of Southwestern Energy
The definition of an insider can differ slightly between different countries, but members of the board of directors always count. Company management run the business, but the CEO will answer to the board, even if he or she is a member of it.
Most consider insider ownership a positive because it can indicate the board is well aligned with other shareholders. However, on some occasions too much power is concentrated within this group.
Our most recent data indicates that insiders own less than 1% of Southwestern Energy Company. It is a pretty big company, so it would be possible for board members to own a meaningful interest in the company, without owning much of a proportional interest. In this case, they own around US$57m worth of shares (at current prices). It is always good to see at least some insider ownership, but it might be worth checking if those insiders have been selling.
General Public Ownership
The general public-- including retail investors -- own 10% stake in the company, and hence can't easily be ignored. While this size of ownership may not be enough to sway a policy decision in their favour, they can still make a collective impact on company policies.
Next Steps:
I find it very interesting to look at who exactly owns a company. But to truly gain insight, we need to consider other information, too.
Many find it useful to take an in depth look at how a company has performed in the past. You can access this detailed graph of past earnings, revenue and cash flow.
If you are like me, you may want to think about whether this company will grow or shrink. Luckily, you can check this free report showing analyst forecasts for its future.
NB: Figures in this article are calculated using data from the last twelve months, which refer to the 12-month period ending on the last date of the month the financial statement is dated. This may not be consistent with full year annual report figures.
New: Manage All Your Stock Portfolios in One Place
We've created the ultimate portfolio companion for stock investors, and it's free.
• Connect an unlimited number of Portfolios and see your total in one currency• Be alerted to new Warning Signs or Risks via email or mobile• Track the Fair Value of your stocks
Try a Demo Portfolio for FreeHave feedback on this article? Concerned about the content? Get in touch with us directly. Alternatively, email editorial-team (at) simplywallst.com.This article by Simply Wall St is general in nature. We provide commentary based on historical data and analyst forecasts only using an unbiased methodology and our articles are not intended to be financial advice. It does not constitute a recommendation to buy or sell any stock, and does not take account of your objectives, or your financial situation. We aim to bring you long-term focused analysis driven by fundamental data. Note that our analysis may not factor in the latest price-sensitive company announcements or qualitative material. Simply Wall St has no position in any stocks mentioned.
Disclaimer: Investing carries risk. This is not financial advice. The above content should not be regarded as an offer, recommendation, or solicitation on acquiring or disposing of any financial products, any associated discussions, comments, or posts by author or other users should not be considered as such either. It is solely for general information purpose only, which does not consider your own investment objectives, financial situations or needs. TTM assumes no responsibility or warranty for the accuracy and completeness of the information, investors should do their own research and may seek professional advice before investing.
Most Discussed
- 1
- 2
- 3
- 4
- 5
- 6
- 7
- 8
- 9
- 10