Jindal Stainless Leads 3 Stocks Possibly Priced Below Intrinsic Estimates
As global markets navigate a period of heightened volatility, with major indices experiencing fluctuations amid busy earnings reports and economic data releases, investors are increasingly focused on identifying opportunities that may be undervalued. In this environment, stocks that are potentially priced below their intrinsic value can offer compelling prospects for those looking to capitalize on market inefficiencies.
Top 10 Undervalued Stocks Based On Cash Flows
| Name | Current Price | Fair Value (Est) | Discount (Est) |
| Tibet Rhodiola Pharmaceutical Holding (SHSE:600211) | CN¥38.67 | CN¥76.89 | 49.7% |
| PharmaResearch (KOSDAQ:A214450) | ₩226500.00 | ₩451715.38 | 49.9% |
| JYP Entertainment (KOSDAQ:A035900) | ₩53900.00 | ₩107294.90 | 49.8% |
| Ingenia Communities Group (ASX:INA) | A$4.73 | A$9.45 | 49.9% |
| BayCurrent Consulting (TSE:6532) | ¥4902.00 | ¥9762.93 | 49.8% |
| EVERTEC (NYSE:EVTC) | US$33.02 | US$65.79 | 49.8% |
| Laboratorio Reig Jofre (BME:RJF) | €2.90 | €5.77 | 49.7% |
| Open Lending (NasdaqGM:LPRO) | US$6.14 | US$12.21 | 49.7% |
| Hunan TV & Broadcast Intermediary (SZSE:000917) | CN¥10.01 | CN¥20.01 | 50% |
| Energy One (ASX:EOL) | A$5.56 | A$11.06 | 49.7% |
Click here to see the full list of 960 stocks from our Undervalued Stocks Based On Cash Flows screener.
We're going to check out a few of the best picks from our screener tool.
Jindal Stainless (NSEI:JSL)
Overview: Jindal Stainless Limited manufactures and sells stainless-steel flat products in India and internationally, with a market cap of ₹563.23 billion.
Operations: The company's revenue primarily comes from its stainless steel products segment, which generated ₹377.88 billion.
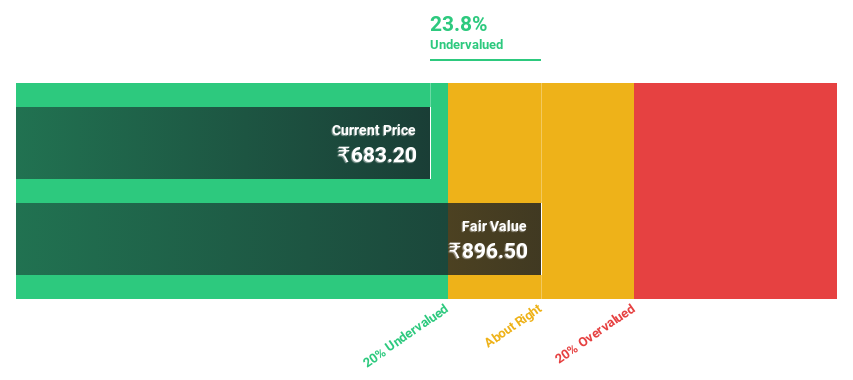
Estimated Discount To Fair Value: 36.9%
Jindal Stainless appears undervalued, trading significantly below its estimated fair value of ₹1,083.76, with a current price of ₹684. Despite a decline in recent earnings, the company's strategic initiatives in sustainable logistics and government projects highlight potential for future growth. Revenue and earnings are projected to grow faster than the Indian market at 18.2% and 30.5% per year respectively, although dividend stability remains uncertain.
- Our expertly prepared growth report on Jindal Stainless implies its future financial outlook may be stronger than recent results.
- Get an in-depth perspective on Jindal Stainless' balance sheet by reading our health report here.
Jiangxi Rimag Group (SEHK:2522)
Overview: Jiangxi Rimag Group Co., Ltd. operates medical imaging centers in China and has a market cap of HK$14.43 billion.
Operations: The company generates revenue of CN¥812.85 million from its medical labs and research segment.
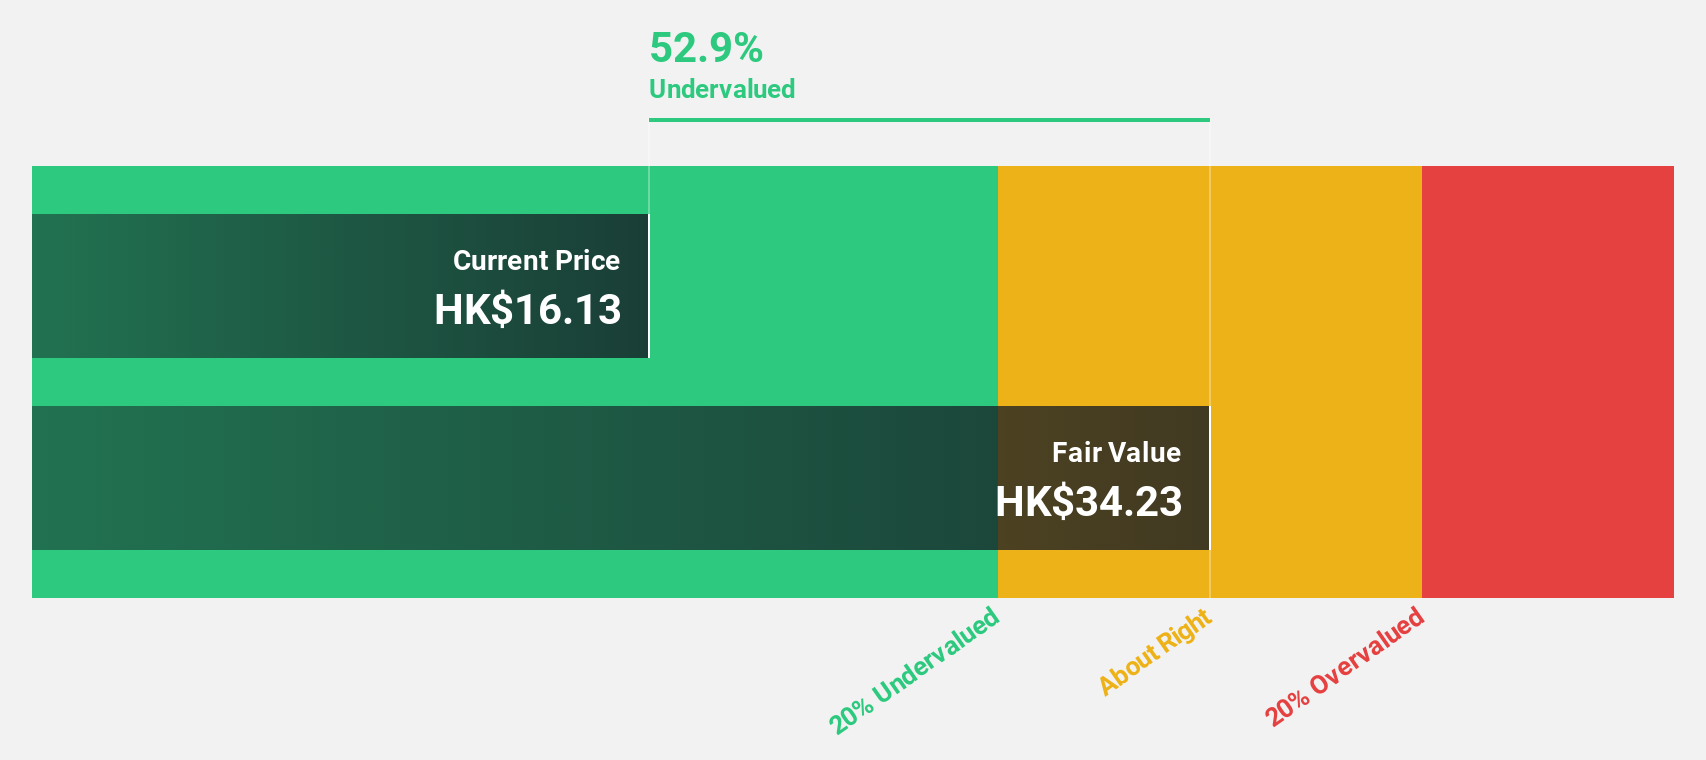
Estimated Discount To Fair Value: 17.5%
Jiangxi Rimag Group is trading at HK$40.5, below its estimated fair value of HK$49.09, indicating potential undervaluation based on cash flows. Despite a decrease in recent earnings and profit margins dropping to 0.6% from 2.6%, the company forecasts significant earnings growth of 71.8% annually over the next three years, outpacing the Hong Kong market's average growth rate. However, return on equity remains low at an anticipated 9.7%.
- Our comprehensive growth report raises the possibility that Jiangxi Rimag Group is poised for substantial financial growth.
- Click here to discover the nuances of Jiangxi Rimag Group with our detailed financial health report.
Fujian Apex SoftwareLTD (SHSE:603383)
Overview: Fujian Apex Software Co., LTD is a professional platform software and information service provider in China with a market cap of CN¥8.82 billion.
Operations: The company generates revenue of CN¥707.34 million from its application software service industry segment.
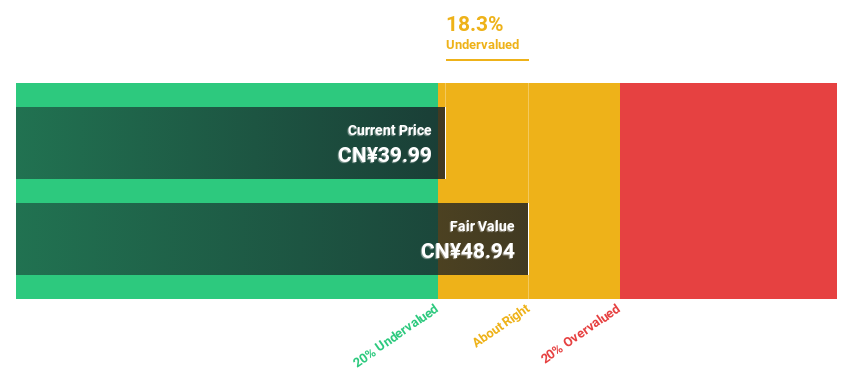
Estimated Discount To Fair Value: 14.4%
Fujian Apex SoftwareLTD, priced at CN¥42.93, is trading below its estimated fair value of CN¥50.18, offering potential undervaluation based on cash flows. Despite recent earnings declines—sales fell to CN¥420.63 million from last year's CN¥457.21 million—the company anticipates significant annual earnings growth of 24.1% over the next three years, exceeding the Chinese market's average revenue growth rate and achieving a high forecasted return on equity of 20.4%.
- Upon reviewing our latest growth report, Fujian Apex SoftwareLTD's projected financial performance appears quite optimistic.
- Dive into the specifics of Fujian Apex SoftwareLTD here with our thorough financial health report.
Make It Happen
- Unlock more gems! Our Undervalued Stocks Based On Cash Flows screener has unearthed 957 more companies for you to explore.Click here to unveil our expertly curated list of 960 Undervalued Stocks Based On Cash Flows.
- Hold shares in these firms? Setup your portfolio in Simply Wall St to seamlessly track your investments and receive personalized updates on your portfolio's performance.
- Maximize your investment potential with Simply Wall St, the comprehensive app that offers global market insights for free.
Interested In Other Possibilities?
- Explore high-performing small cap companies that haven't yet garnered significant analyst attention.
- Diversify your portfolio with solid dividend payers offering reliable income streams to weather potential market turbulence.
- Fuel your portfolio with companies showing strong growth potential, backed by optimistic outlooks both from analysts and management.
This article by Simply Wall St is general in nature. We provide commentary based on historical data and analyst forecasts only using an unbiased methodology and our articles are not intended to be financial advice. It does not constitute a recommendation to buy or sell any stock, and does not take account of your objectives, or your financial situation. We aim to bring you long-term focused analysis driven by fundamental data. Note that our analysis may not factor in the latest price-sensitive company announcements or qualitative material. Simply Wall St has no position in any stocks mentioned.
New: Manage All Your Stock Portfolios in One Place
We've created the ultimate portfolio companion for stock investors, and it's free.
• Connect an unlimited number of Portfolios and see your total in one currency• Be alerted to new Warning Signs or Risks via email or mobile• Track the Fair Value of your stocks
Try a Demo Portfolio for FreeHave feedback on this article? Concerned about the content? Get in touch with us directly. Alternatively, email editorial-team@simplywallst.com
Disclaimer: Investing carries risk. This is not financial advice. The above content should not be regarded as an offer, recommendation, or solicitation on acquiring or disposing of any financial products, any associated discussions, comments, or posts by author or other users should not be considered as such either. It is solely for general information purpose only, which does not consider your own investment objectives, financial situations or needs. TTM assumes no responsibility or warranty for the accuracy and completeness of the information, investors should do their own research and may seek professional advice before investing.
Most Discussed
- 1
- 2
- 3
- 4
- 5
- 6
- 7
- 8
- 9
- 10