Solana Faces $6 Billion Short Bet as Price Drops 12% from Peak
- Solana (SOL) has dropped 11% from its all-time high of $264.63, now trading at $232.72 as traders bet on further declines.
- $6 billion in short positions outpace long bets, signaling growing bearish sentiment among traders.
- 20-day EMA support at $226.52 is crucial; a break below this level could lead SOL to $205.56, while a bullish shift may push it back to its peak.
Solana (SOL) has faced increased selling pressure since it climbed to an all-time high of $264.63 on November 24. Exchanging hands at $232.72 at press time, the coin’s value has since dropped by 12%.
With waning bullish sentiment in the broader cryptocurrency market, this downward trend has prompted a surge in short positions, with traders betting on a further SOL price drop.
Solana Price Drops as Futures Traders Bet Against the Rally
According to Coinglass, over the past 24 hours, the total value of Solana short positions has reached $6 billion, significantly outpacing long positions at $5.38 billion. This indicates a strong bearish sentiment among traders.
As of this writing, SOL’s long/short ratio stands at 0.96. An asset’s long/short ratio measures the proportion of open long positions (bets on price increases) to short positions (bets on price declines) in a given market.
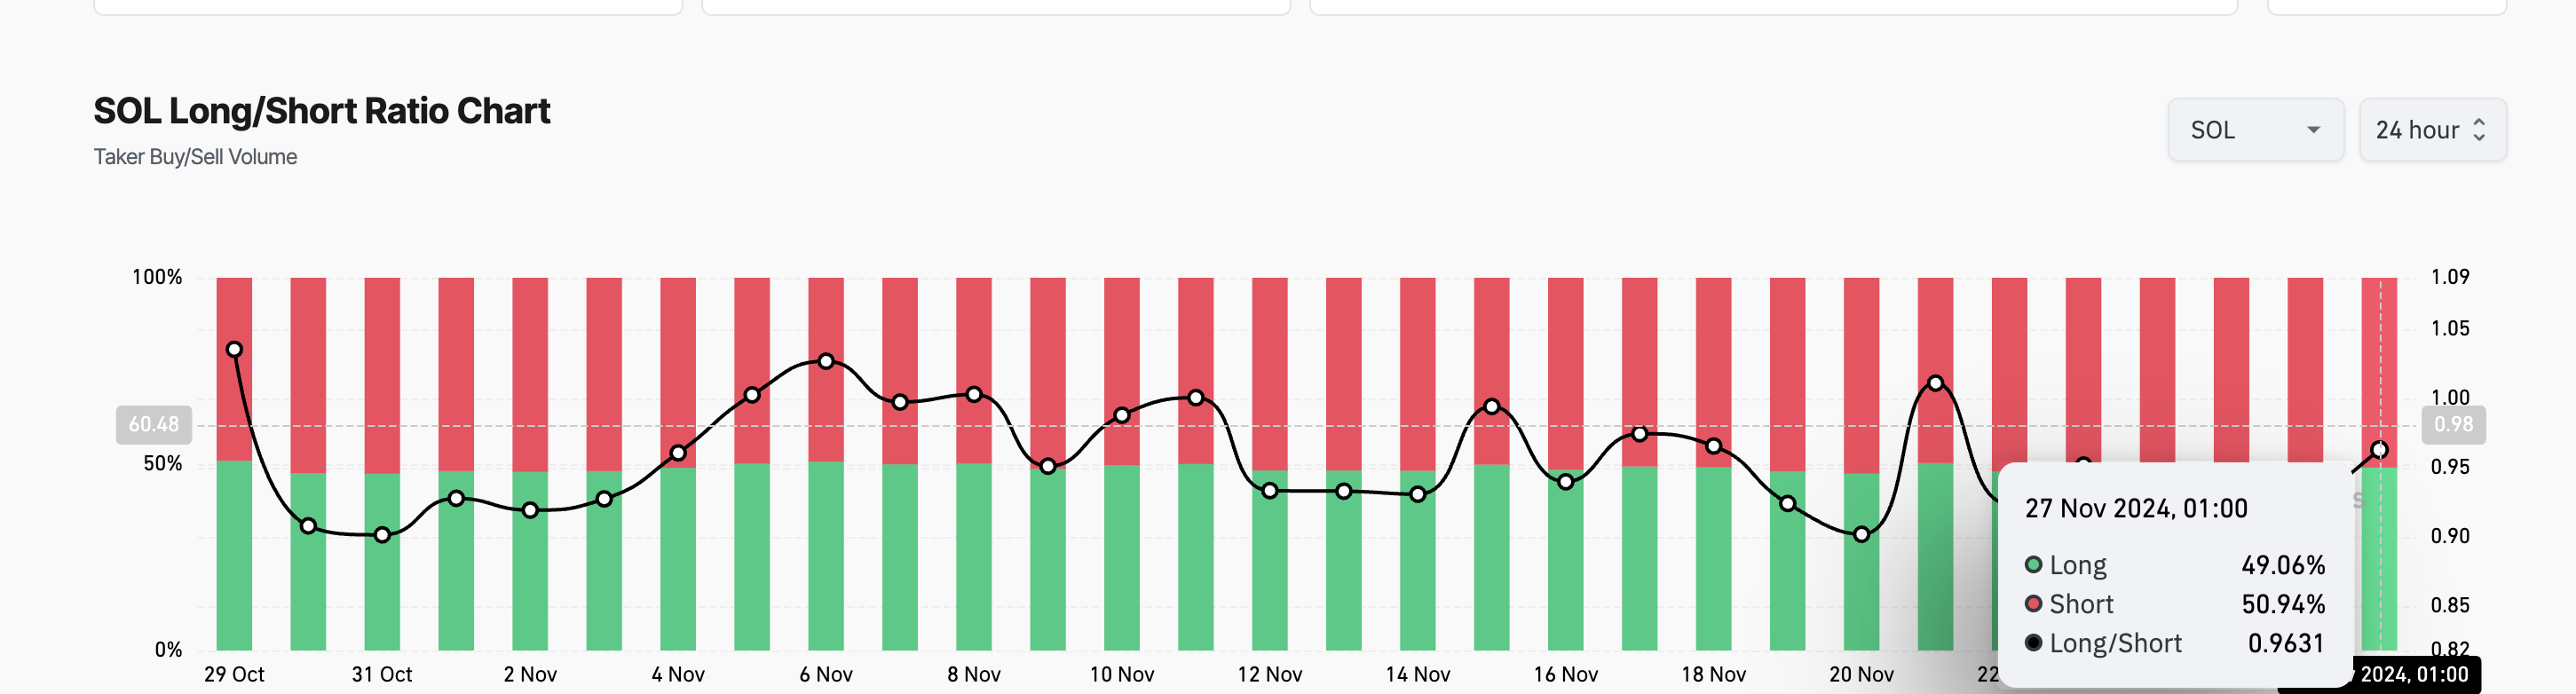
When the ratio is below 1, it indicates that there are more short positions than long ones, suggesting that more traders are betting on a price decline than those anticipating a price rally.
Further, SOL’s negative weighted sentiment confirms the bearish bias towards it. As of this writing, this stands at -0.40.
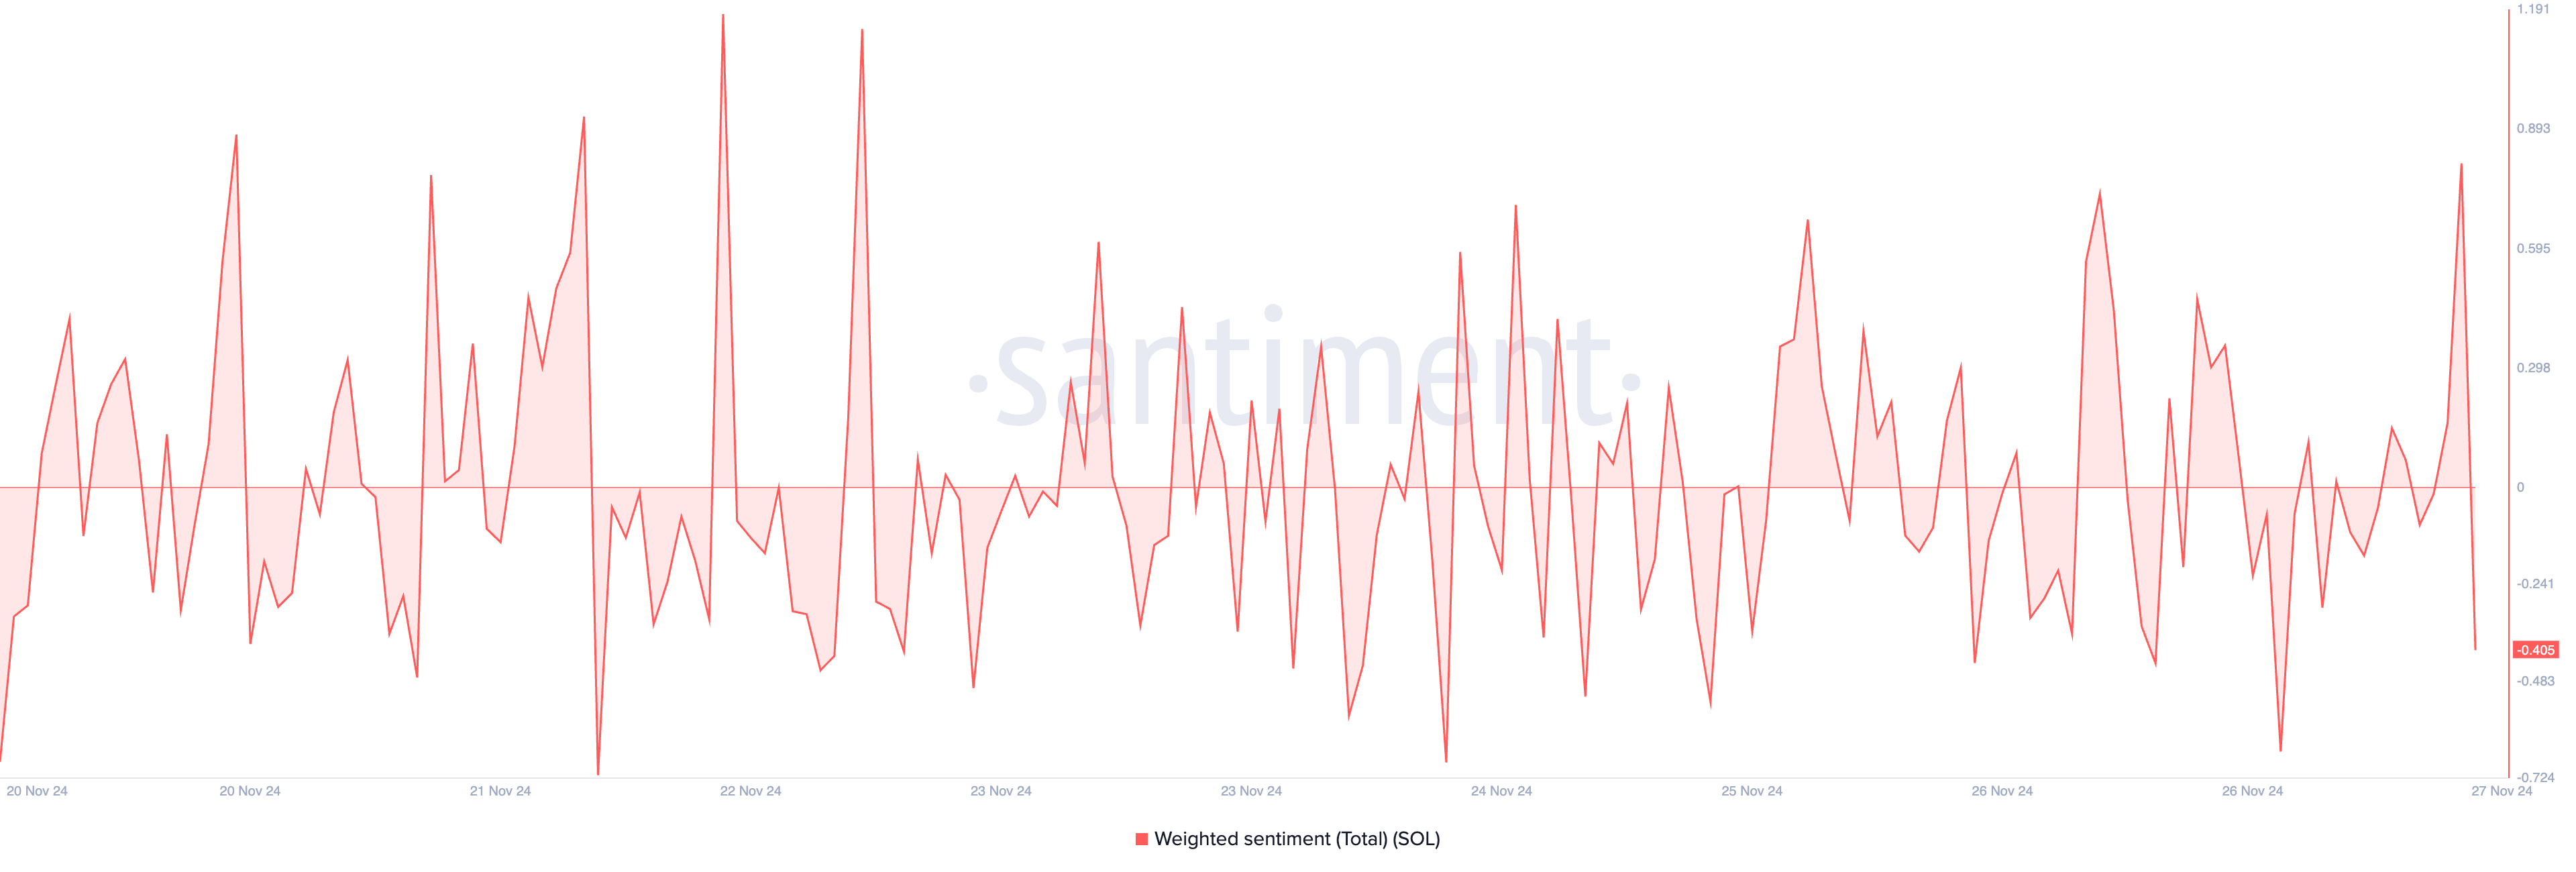
An asset’s weighted sentiment metric tracks the overall mood of the market regarding it. When the value of an asset’s weighted sentiment is negative, most social media discussions are fueled by negative emotions. This indicates that market participants expect the price to decline and have gradually reduced their trading activity to prevent losses.
SOL Price Prediction: The 20-Day EMA Is Key
On the daily chart, SOL’s price is poised to break below its 20-day Exponential Moving Average (EMA). This indicator tracks the asset’s average price over 20 days, giving more weight to recent prices.
Since October 11, it has consistently served as a dynamic support level for SOL. Currently, the 20-day EMA provides support at $226.52, and a decisive break below this level would confirm the shift toward bearish momentum. If this happens, the SOL price drop may reach $205.56.
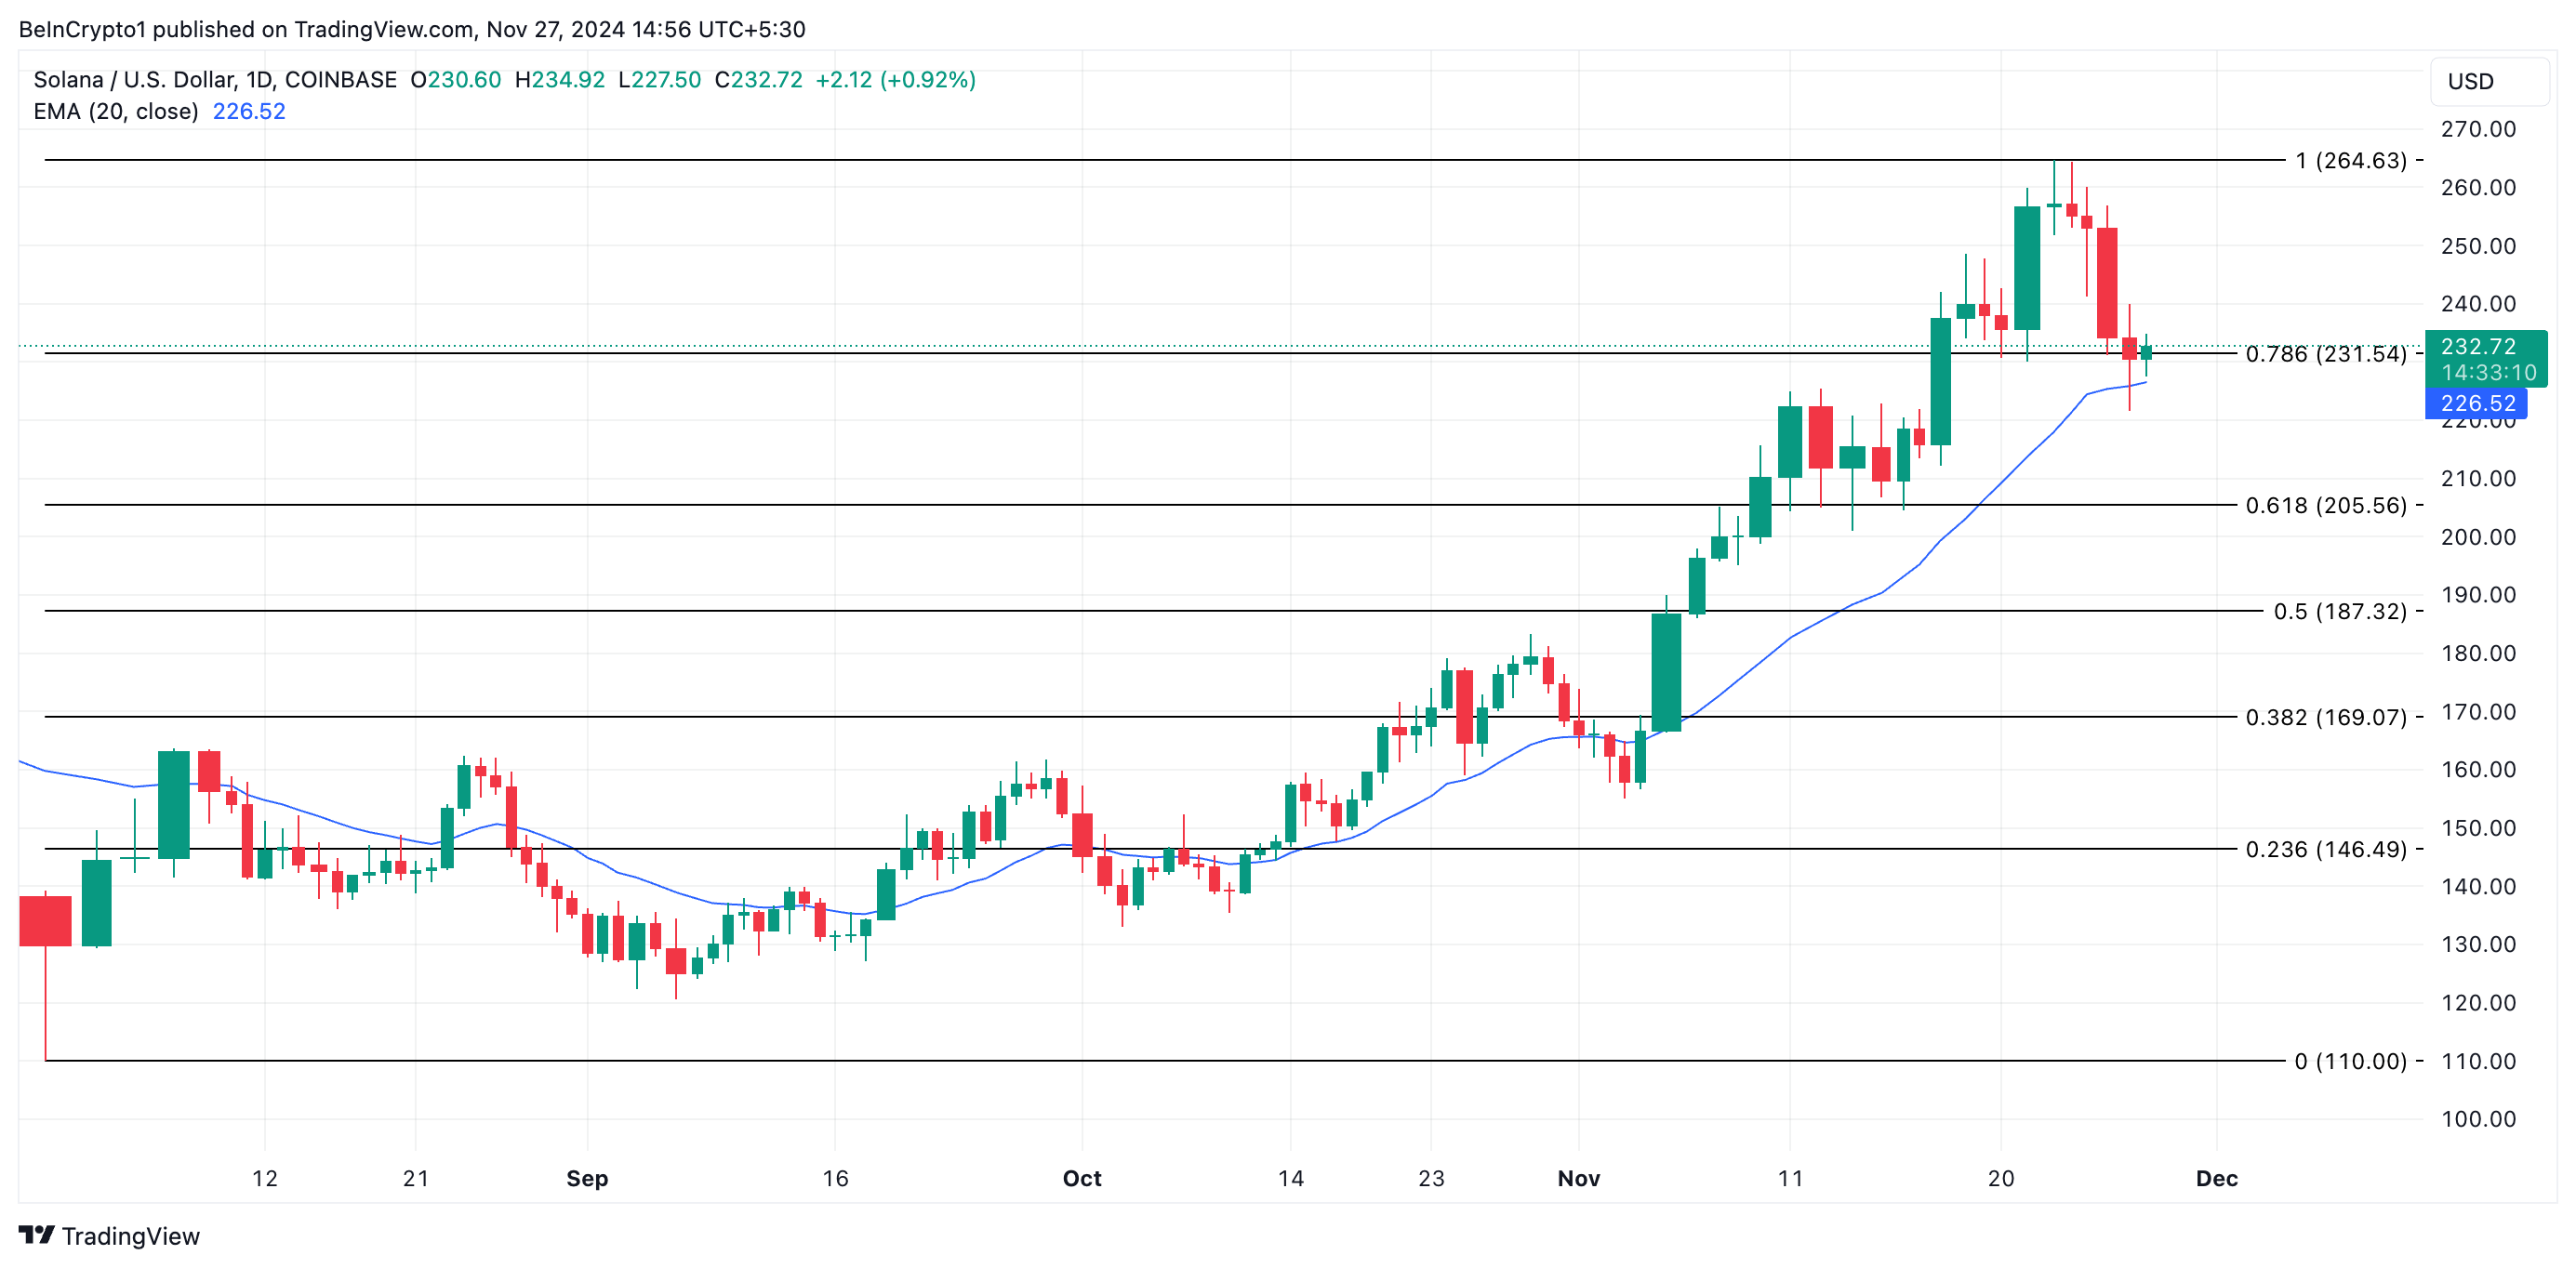
On the other hand, if market sentiment becomes more bullish, SOL’s price may rally toward its all-time high of $264.63.
Disclaimer: Investing carries risk. This is not financial advice. The above content should not be regarded as an offer, recommendation, or solicitation on acquiring or disposing of any financial products, any associated discussions, comments, or posts by author or other users should not be considered as such either. It is solely for general information purpose only, which does not consider your own investment objectives, financial situations or needs. TTM assumes no responsibility or warranty for the accuracy and completeness of the information, investors should do their own research and may seek professional advice before investing.
Most Discussed
- 1
- 2
- 3
- 4
- 5
- 6
- 7
- 8
- 9
- 10