Helium (HNT) Price Could Fall Below $7 If This Happens
- Helium (HNT) price rises 8% as technical indicators show mixed signals for its next move.
- ADX suggests weakening trend strength with momentum cooling off from recent highs.
- EMA hints at potential bullish crossover that could push HNT toward $9.53 resistance.
Helium (HNT) price is up more than 8% in the last 24 hours, drawing attention as it attempts to regain its recent momentum. Despite the short-term gains, technical indicators suggest mixed signals for its future trend.
The ADX highlights weakening trend strength, while the RSI points to a neutral zone. With EMA lines showing potential for a bullish crossover, HNT faces a pivotal moment that could determine whether it surges toward $9.53 or tests critical support levels near $6.86.
HNT Current Trend Is Losing Its Steam
Helium Average Directional Index (ADX) is currently at 26.5, a significant drop from over 50 just one week ago. During that time, its price reached levels above $9, marking the first time it hit those highs since March 2024.
The decline in ADX reflects a reduction in the strength of its recent uptrend, potentially signaling a pause or slowdown in momentum.
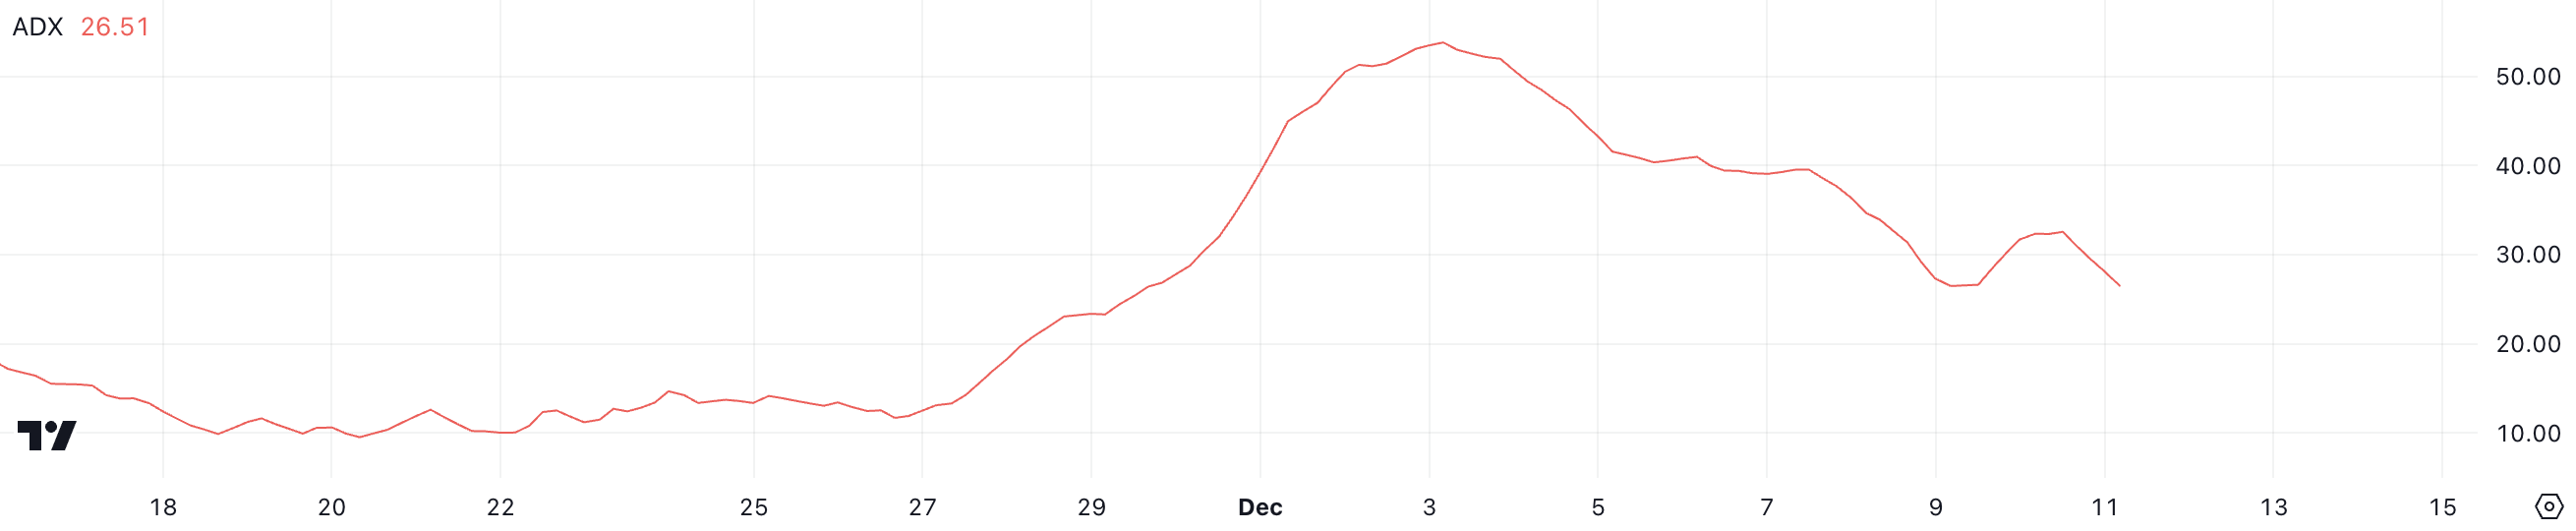
The ADX measures the strength of a trend but not its direction. Values above 25 indicate a strong trend, while readings below 20 suggest a weak or no trend.
At 26.5, HNT ADX hovers just above the strong trend threshold, indicating that while the trend remains intact, it is weakening. If HNT price aims to recover its uptrend, the ADX must climb higher, signaling renewed momentum and stronger buying interest.
Helium RSI Is Currently Neutral
HNT’s Relative Strength Index (RSI) is currently at 52, a decline from over 70 earlier in December when its price experienced a sharp surge. This drop indicates reduced buying momentum compared to the earlier overbought conditions.
While the RSI remains in the neutral zone, it reflects a cooling off in market enthusiasm following the recent rally. It’s also important to note that HNT RSI reached 28 on December 10, showing that buying pressure could be returning.
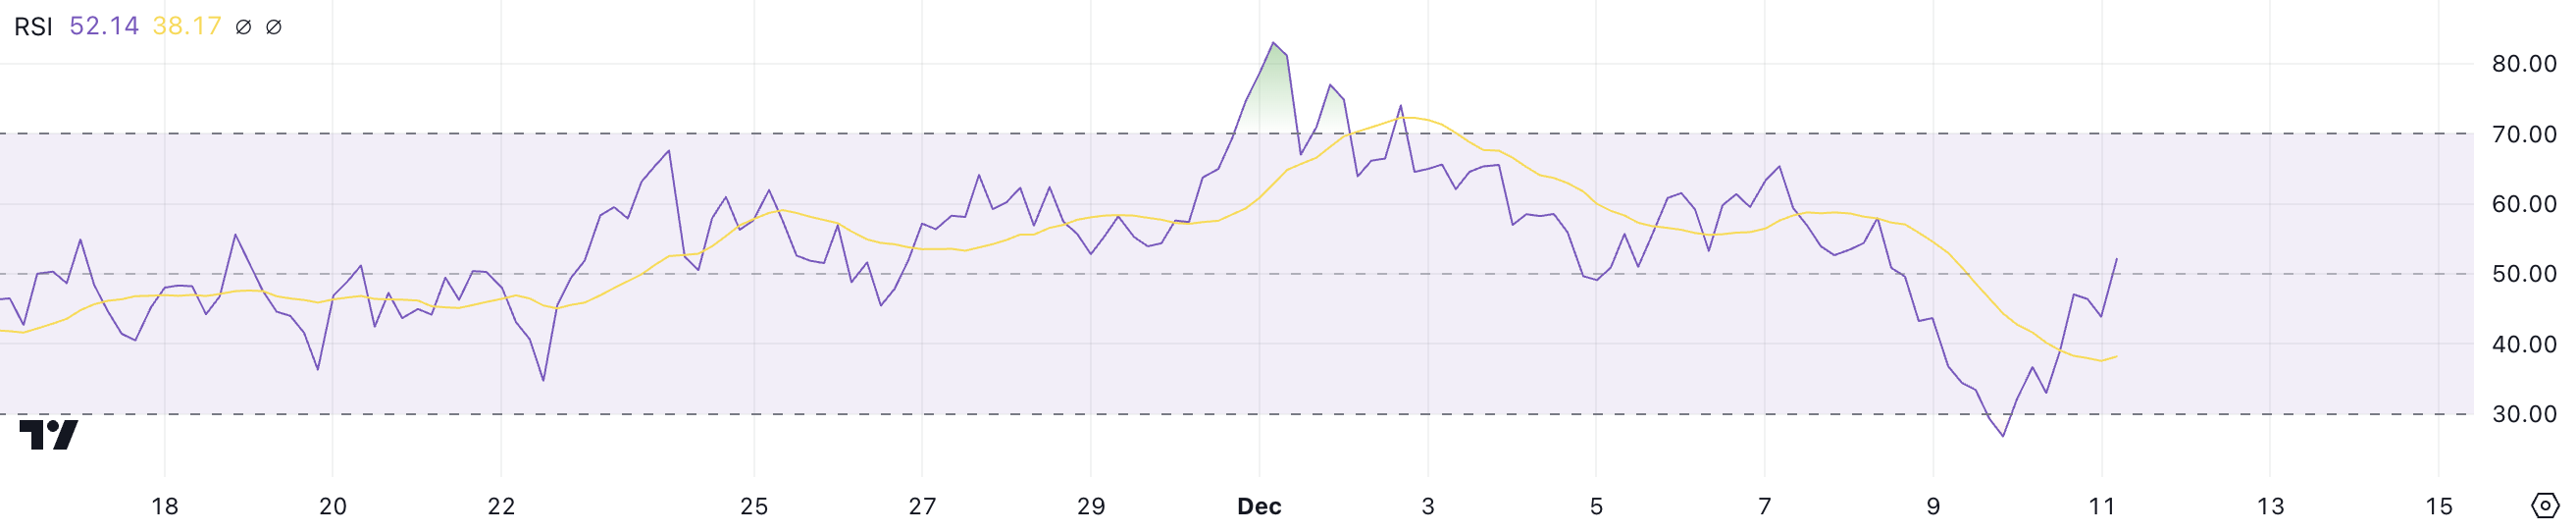
The RSI measures the speed and magnitude of price changes, ranging from 0 to 100. Values above 70 indicate overbought conditions, often signaling a potential reversal or correction. Readings below 30 suggest oversold conditions, where prices might rebound.
With an RSI at 52, the HNT price is neither overbought nor oversold, suggesting it is consolidating. To resume its uptrend, the RSI would need to climb, reflecting renewed buying strength. Conversely, a drop below 50 could hint at further weakening momentum.
HNT Price Prediction: Can It Reach $9 Again?
Helium Exponential Moving Average (EMA) lines are showing mixed signals. Recently, its shortest EMA crossed below another, signaling bearish momentum.
However, the shortest EMA has started rising again. If it crosses back above, it could indicate renewed bullish energy and potentially spark a price surge as the DePin (Decentralized Physical Infrastructure) narrative tries to keep building traction.
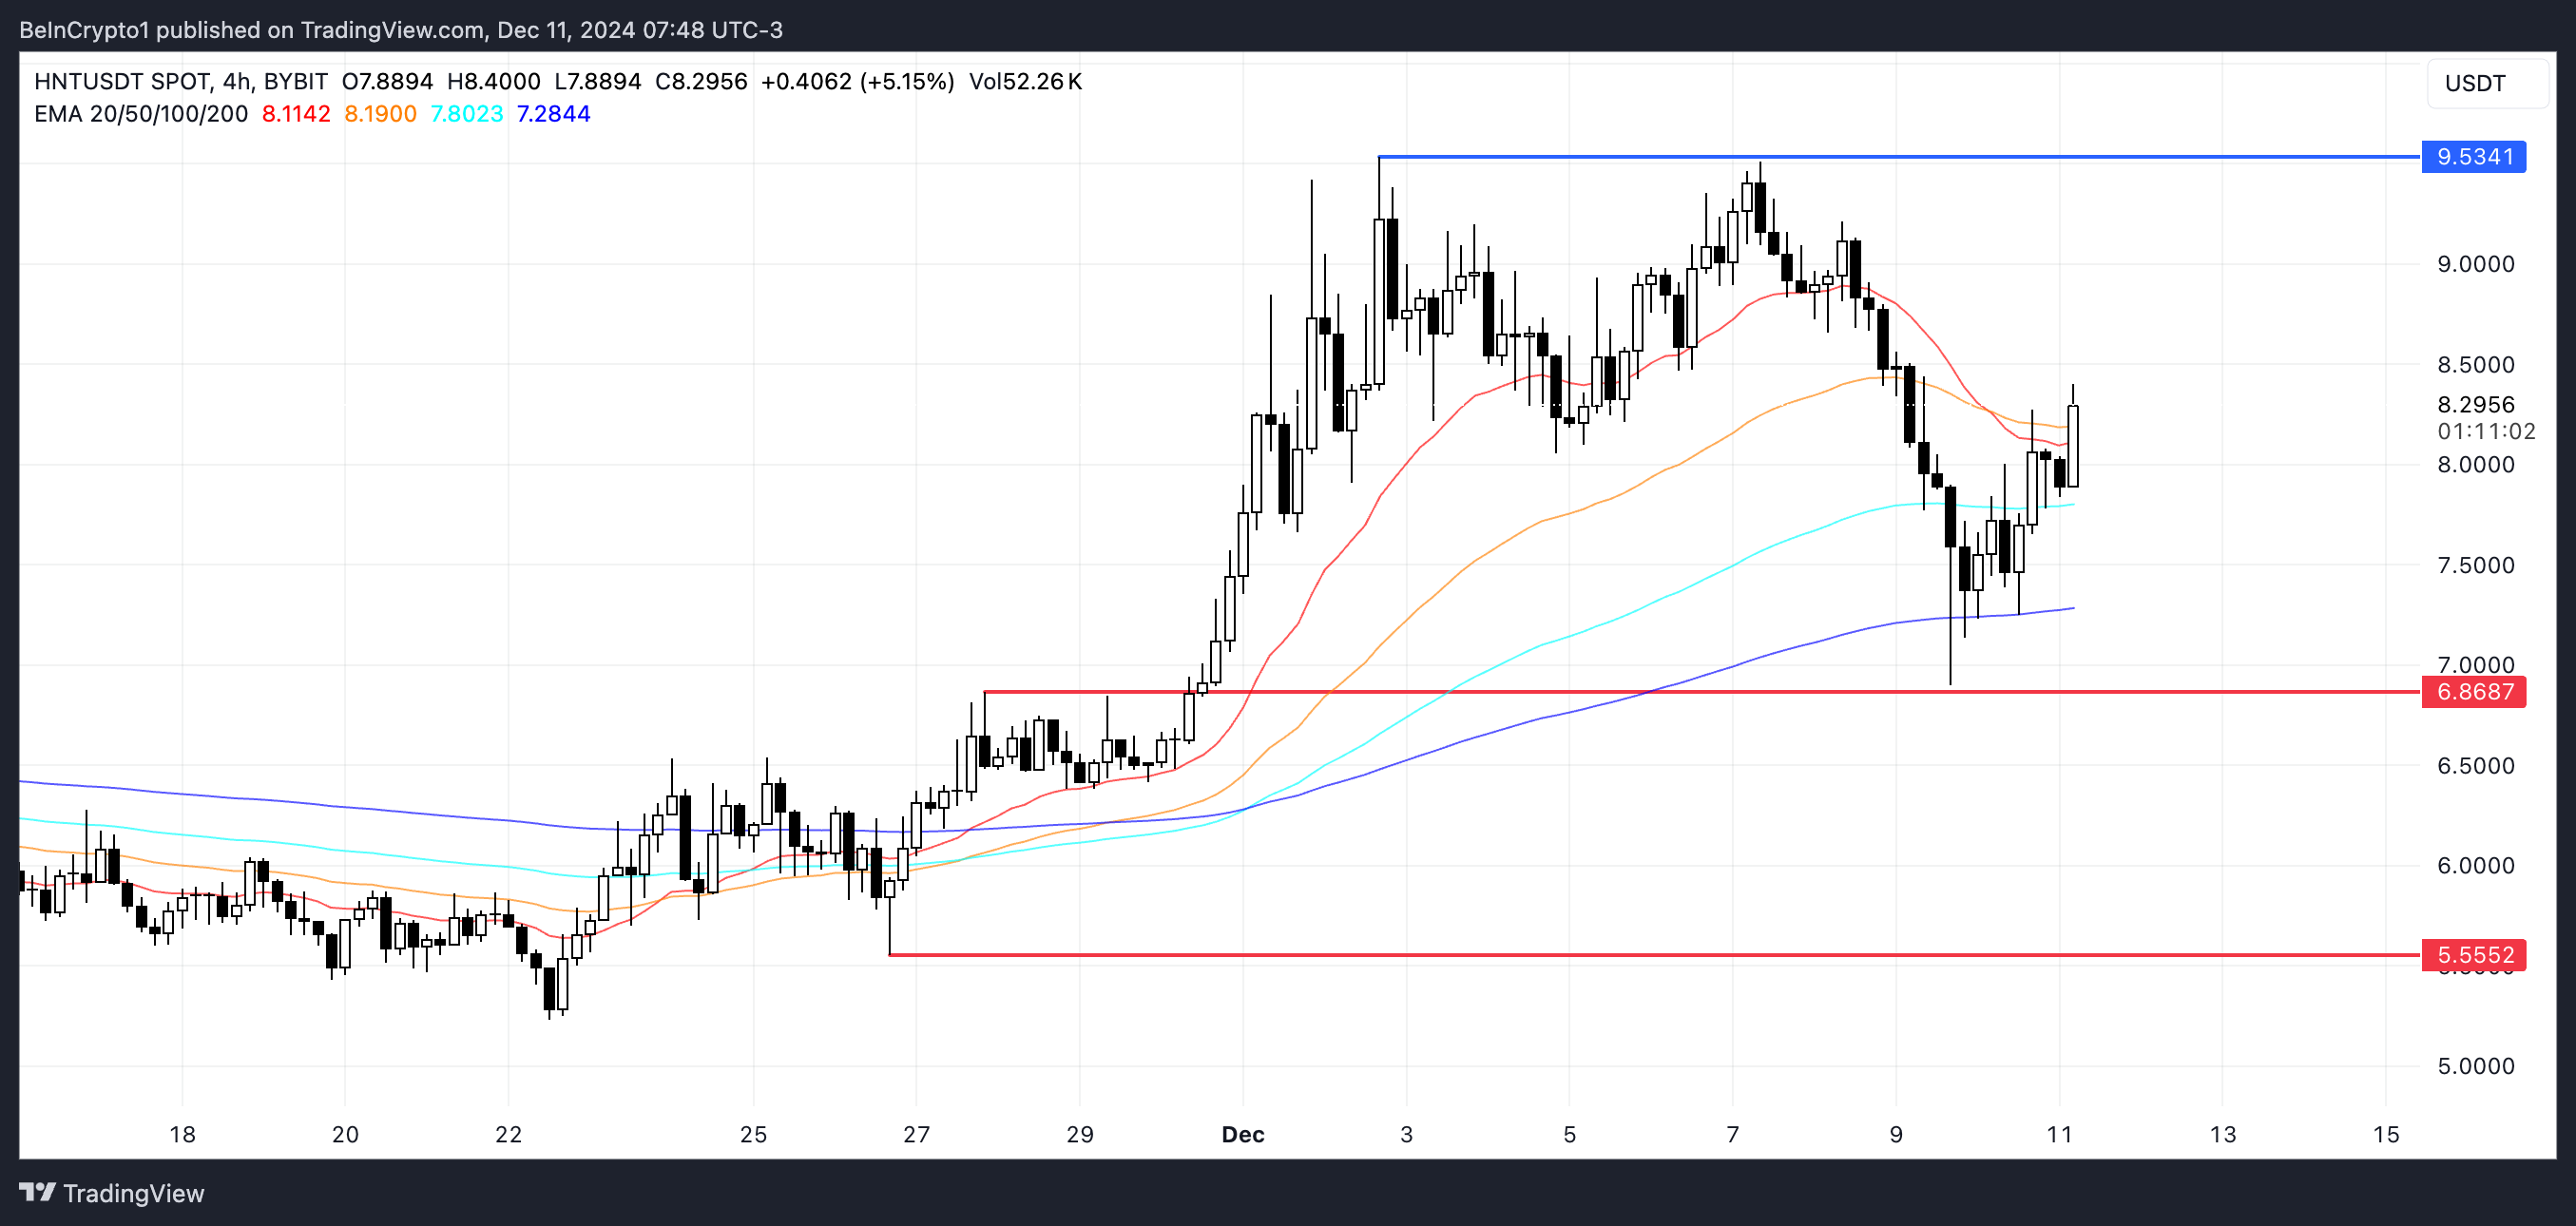
If a bullish crossover occurs, Helium price could retest resistance around $9.53. However, the weakening trend highlighted by ADX suggests caution. If a downtrend develops instead, HNT price might test support at $6.86.
If that level fails to hold, the price could drop further to $5.55, representing a possible 33% decline.
Disclaimer: Investing carries risk. This is not financial advice. The above content should not be regarded as an offer, recommendation, or solicitation on acquiring or disposing of any financial products, any associated discussions, comments, or posts by author or other users should not be considered as such either. It is solely for general information purpose only, which does not consider your own investment objectives, financial situations or needs. TTM assumes no responsibility or warranty for the accuracy and completeness of the information, investors should do their own research and may seek professional advice before investing.
Most Discussed
- 1
- 2
- 3
- 4
- 5
- 6
- 7
- 8
- 9
- 10