HBAR Rides the Bull: An 11% Surge Points to More Gains Ahead
- HBAR surged 11% in 24 hours, backed by rising demand and bullish technical indicators signaling the potential for further gains.
- Super Trend support at $0.23 signals bullish momentum; breaking $0.39 could mark a new three-year high.
- Rising Chaikin Money Flow (CMF) suggests strong buying pressure, supporting the likelihood of sustained upward price movement.
HBAR, the native token powering the Hedera Hashgraph distributed ledger, has seen an 11% price surge in the past 24 hours. This price rally comes amidst a noticeable rise in demand for the token in the past few days.
Technical analysis suggests that HBAR may be poised for further gains. This analysis highlights price levels that token holders need to pay attention to.
Hedera Token Holders Intensify Accumulation
Readings from HBAR’s daily chart show that despite its recent pullback, its price has remained above the Super Trend indicator, which continues to offer dynamic support at $0.23.
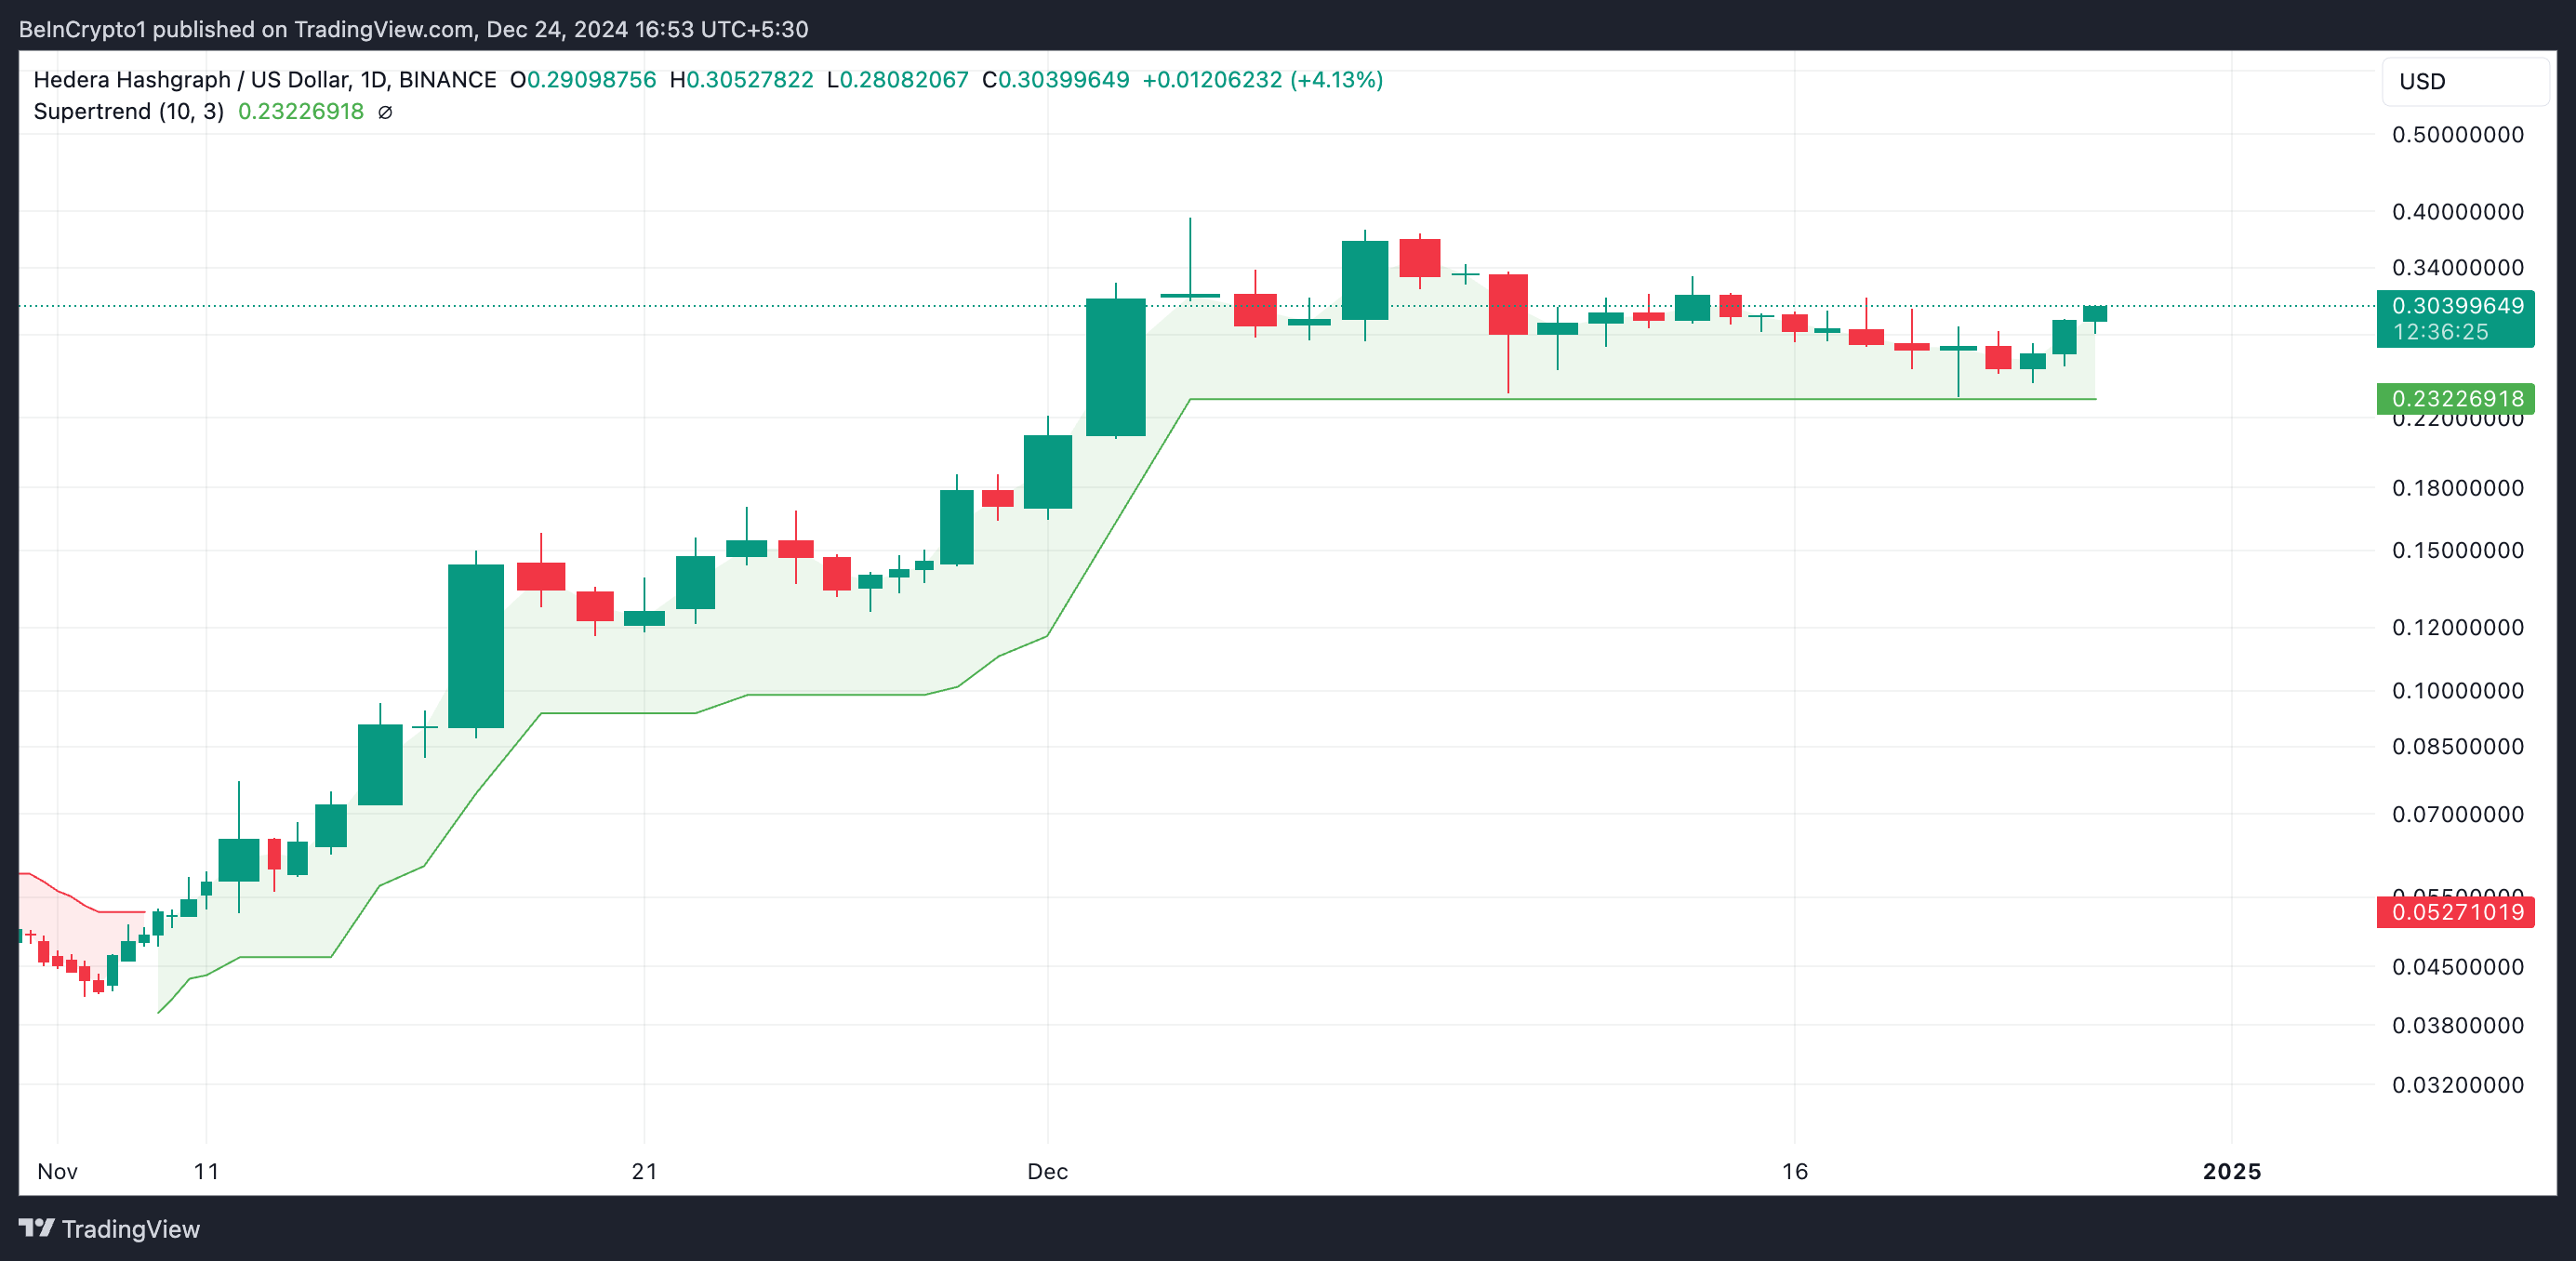
The Super Trend indicator tracks the direction and strength of an asset’s price trend. It is displayed as a line on the price chart, changing color to signify the trend: green for an uptrend and red for a downtrend.
If an asset’s price is above the Super Trend line, it signals bullish momentum in the market. In this scenario, this line offers dynamic support, and as long as the price remains above it, the bullish trend is likely to continue.
Furthermore, HBAR’s rising Chaikin Money Flow (CMF) hints at the likelihood of a sustained rally. At press time, this is at 0.05.
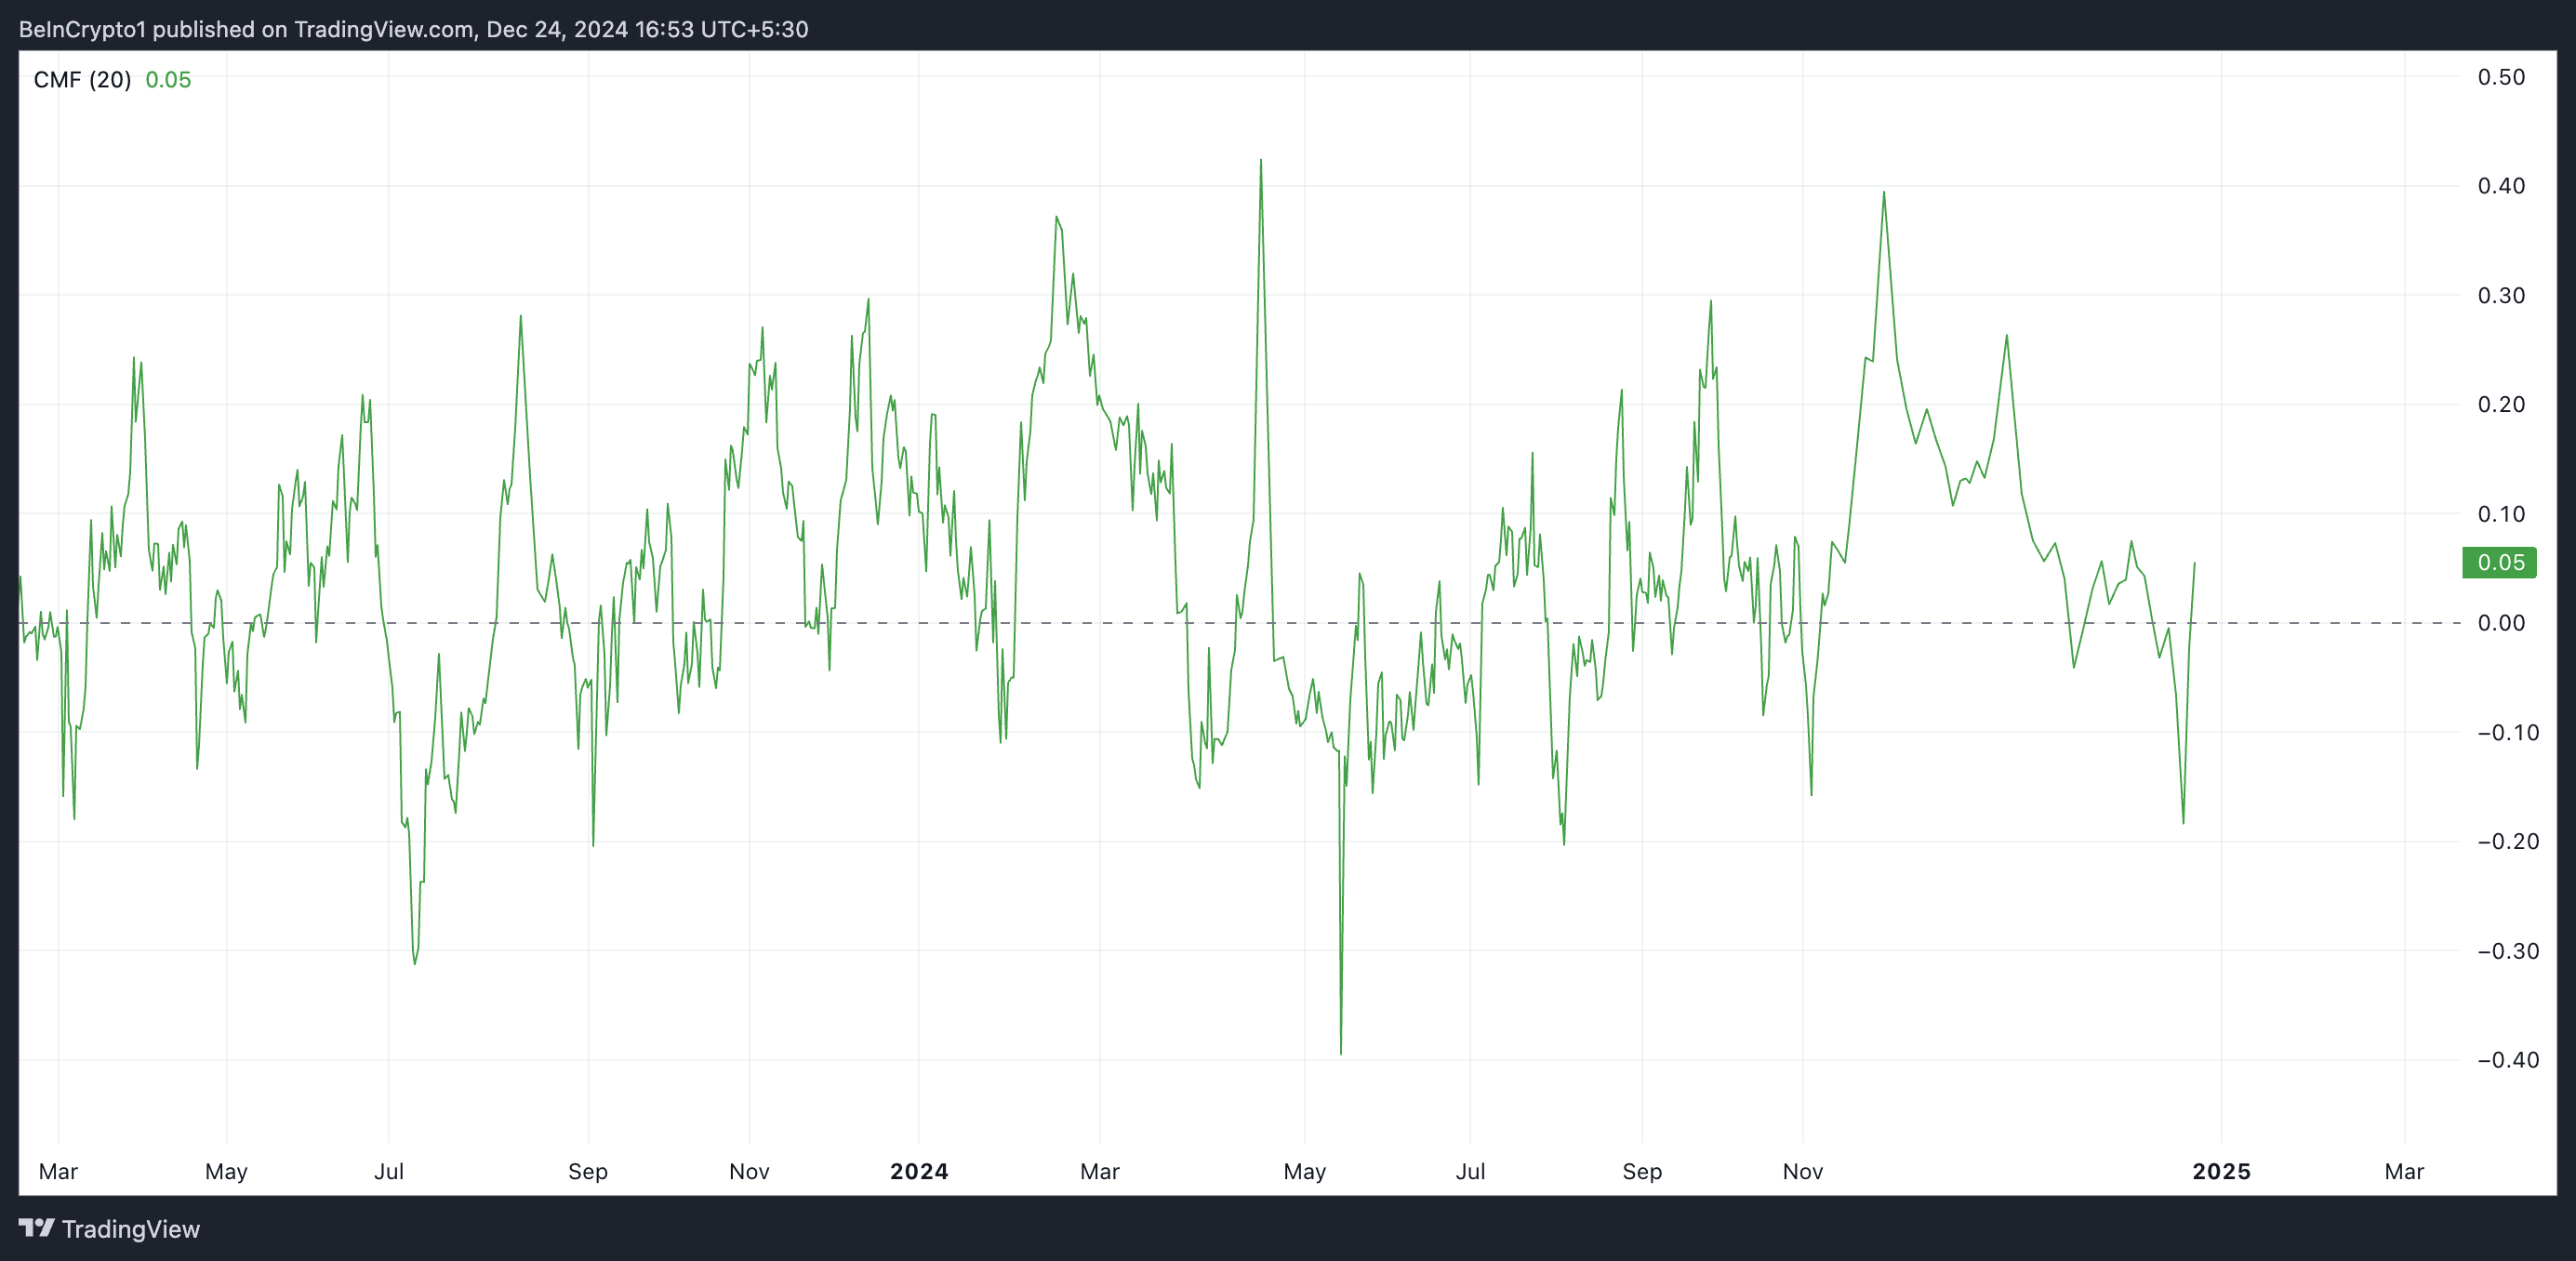
This indicator measures money flows into and out of an asset’s market. As with HBAR, when its value is positive during a price rally, it indicates strong buying pressure as more volume is flowing into the asset than out. This suggests that the price rally is supported by actual accumulation, increasing the likelihood of a sustained uptrend.
HBAR Price Prediction: Bulls Eye $0.39 While Bears Target $0.24
According to its Fibonacci Retracement tool, HBAR’s price will revisit its three-year high of $0.39 and rally past it if accumulation persists. That price level must be flipped into a support floor for this to happen.
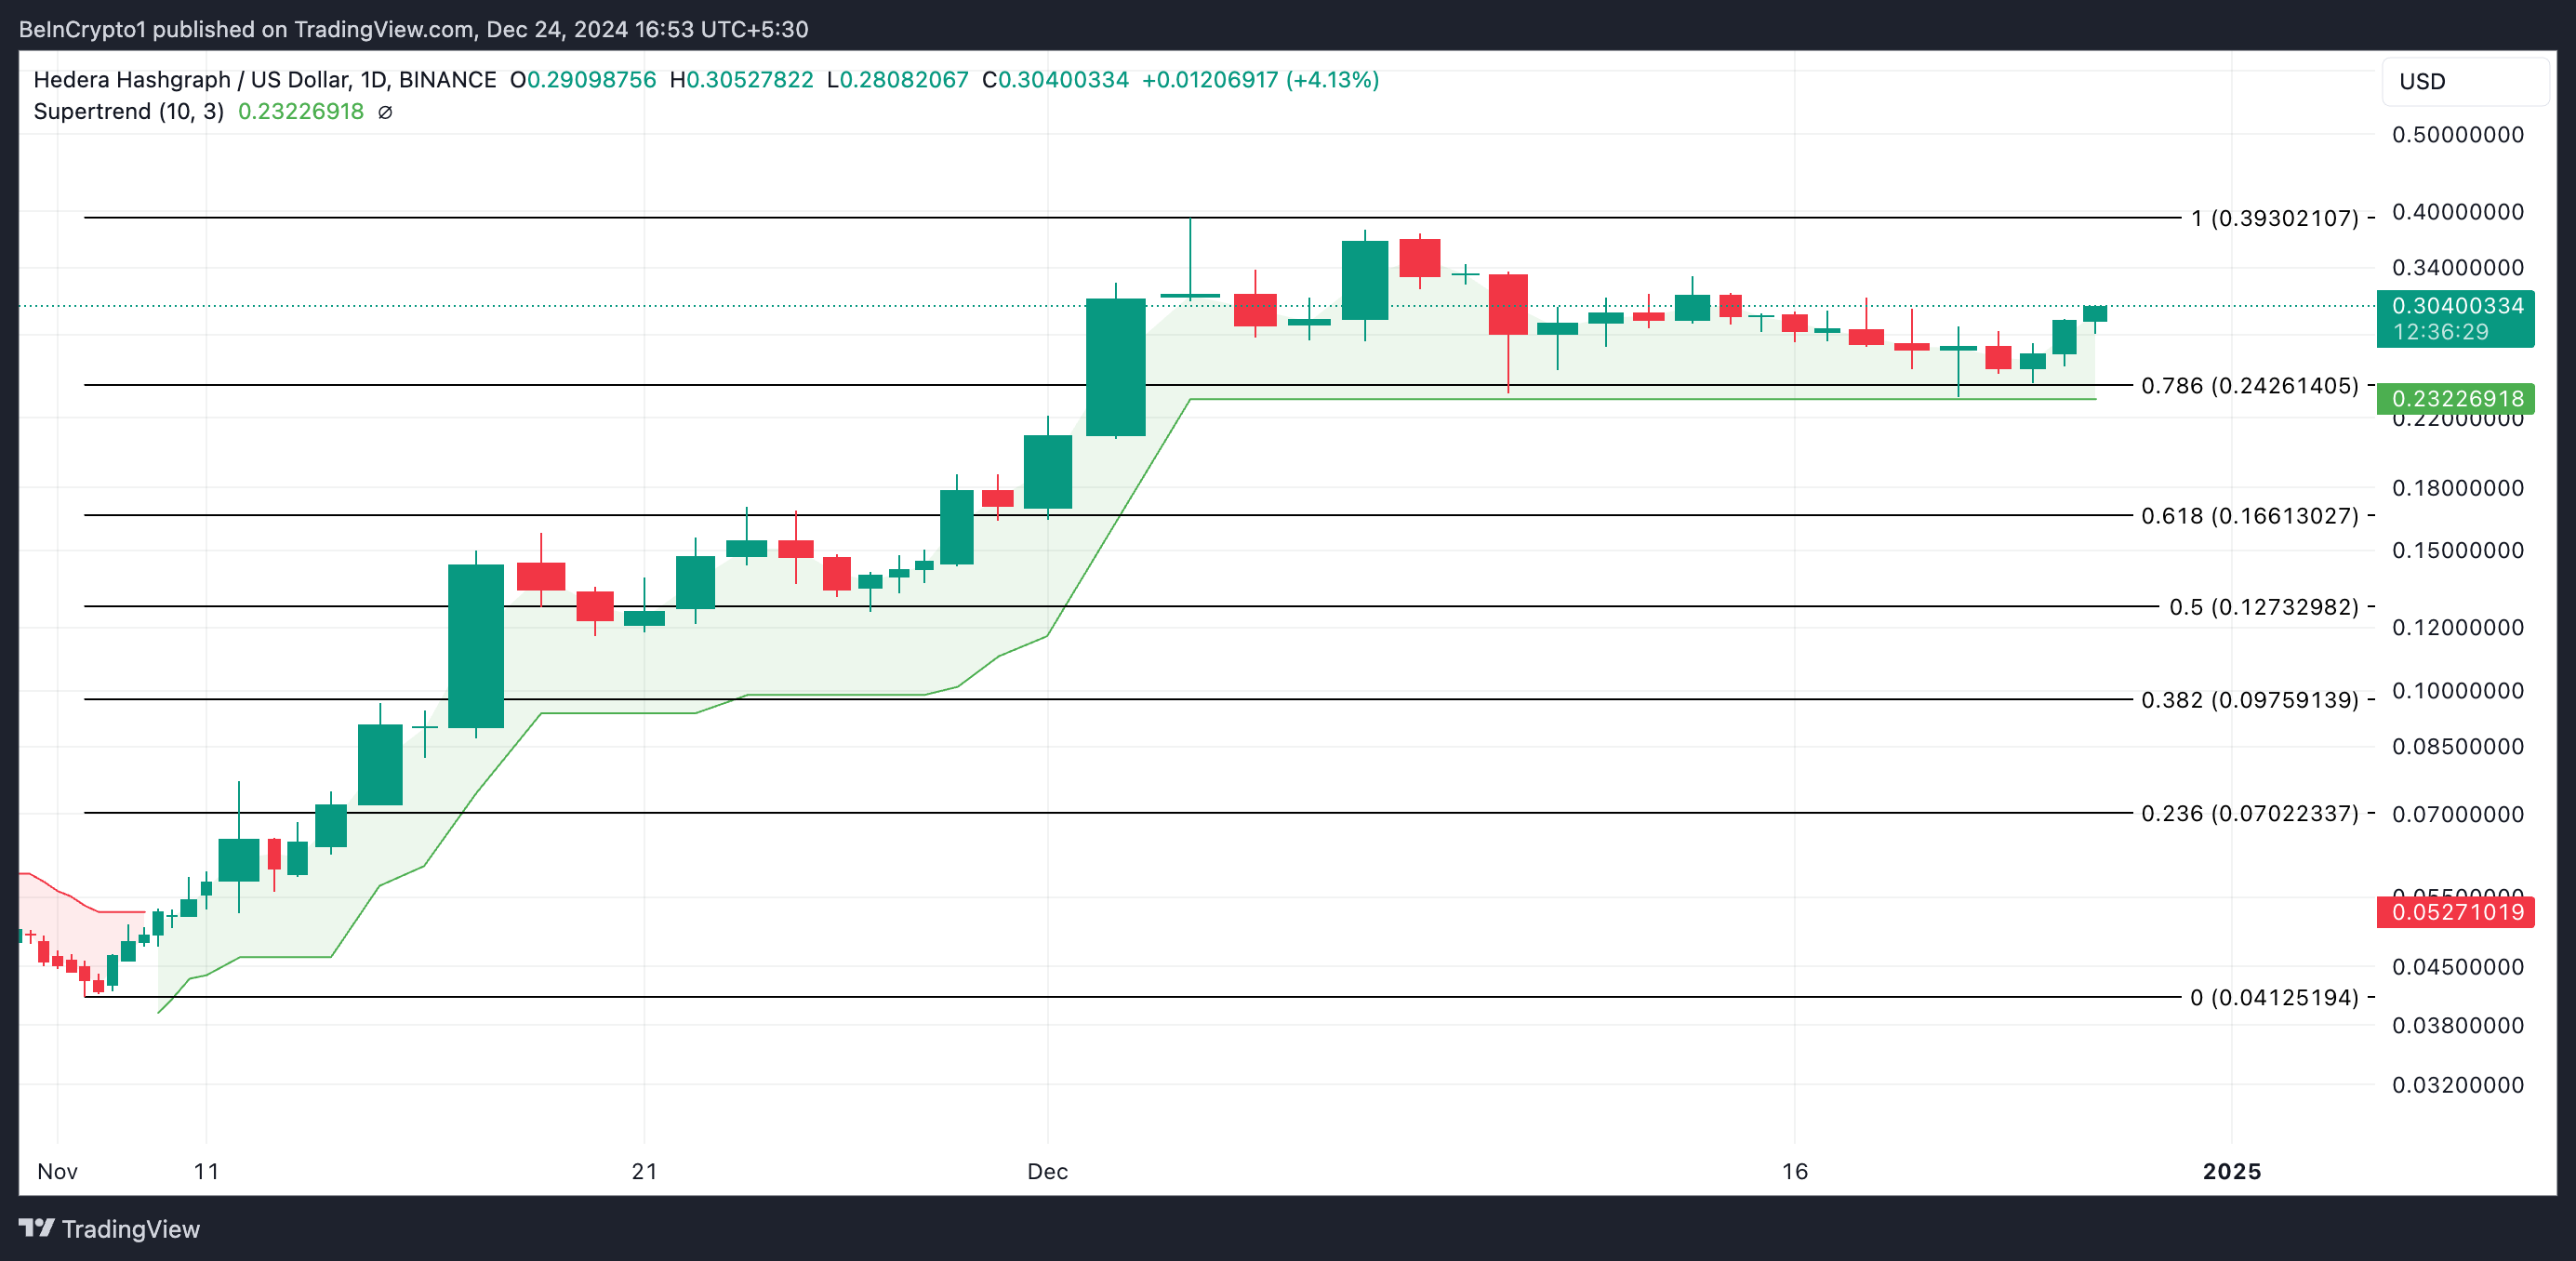
On the other hand, if selloffs resurge, HBAR’s price will shed some of its recent gains and trend toward $0.24. A break below this level will cause a further decline to the Super Trend’s dynamic support of $0.23. If this level fails to hold, the HBAR token price may plunge to $0.16.
Disclaimer: Investing carries risk. This is not financial advice. The above content should not be regarded as an offer, recommendation, or solicitation on acquiring or disposing of any financial products, any associated discussions, comments, or posts by author or other users should not be considered as such either. It is solely for general information purpose only, which does not consider your own investment objectives, financial situations or needs. TTM assumes no responsibility or warranty for the accuracy and completeness of the information, investors should do their own research and may seek professional advice before investing.
Most Discussed
- 1
- 2
- 3
- 4
- 5
- 6
- 7
- 8
- 9
- 10