Returns On Capital Are A Standout For Qantas Airways (ASX:QAN)
There are a few key trends to look for if we want to identify the next multi-bagger. Firstly, we'll want to see a proven return on capital employed (ROCE) that is increasing, and secondly, an expanding base of capital employed. Put simply, these types of businesses are compounding machines, meaning they are continually reinvesting their earnings at ever-higher rates of return. With that in mind, the ROCE of Qantas Airways (ASX:QAN) looks great, so lets see what the trend can tell us.
Return On Capital Employed (ROCE): What Is It?
For those that aren't sure what ROCE is, it measures the amount of pre-tax profits a company can generate from the capital employed in its business. Analysts use this formula to calculate it for Qantas Airways:
Return on Capital Employed = Earnings Before Interest and Tax (EBIT) ÷ (Total Assets - Current Liabilities)
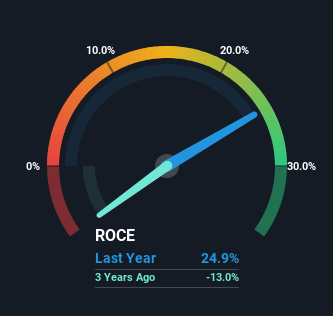
0.25 = AU$2.2b ÷ (AU$21b - AU$12b) (Based on the trailing twelve months to June 2024).
Thus, Qantas Airways has an ROCE of 25%. In absolute terms that's a great return and it's even better than the Airlines industry average of 8.9%.
View our latest analysis for Qantas Airways
In the above chart we have measured Qantas Airways' prior ROCE against its prior performance, but the future is arguably more important. If you'd like to see what analysts are forecasting going forward, you should check out our free analyst report for Qantas Airways .
What Can We Tell From Qantas Airways' ROCE Trend?
Qantas Airways has not disappointed in regards to ROCE growth. We found that the returns on capital employed over the last five years have risen by 133%. That's a very favorable trend because this means that the company is earning more per dollar of capital that's being employed. In regards to capital employed, Qantas Airways appears to been achieving more with less, since the business is using 23% less capital to run its operation. Qantas Airways may be selling some assets so it's worth investigating if the business has plans for future investments to increase returns further still.
For the record though, there was a noticeable increase in the company's current liabilities over the period, so we would attribute some of the ROCE growth to that. Effectively this means that suppliers or short-term creditors are now funding 57% of the business, which is more than it was five years ago. And with current liabilities at those levels, that's pretty high.
What We Can Learn From Qantas Airways' ROCE
In a nutshell, we're pleased to see that Qantas Airways has been able to generate higher returns from less capital. And investors seem to expect more of this going forward, since the stock has rewarded shareholders with a 48% return over the last five years. With that being said, we still think the promising fundamentals mean the company deserves some further due diligence.
If you want to know some of the risks facing Qantas Airways we've found 3 warning signs (1 is a bit unpleasant!) that you should be aware of before investing here.
Qantas Airways is not the only stock earning high returns. If you'd like to see more, check out our free list of companies earning high returns on equity with solid fundamentals.
Valuation is complex, but we're here to simplify it.
Discover if Qantas Airways might be undervalued or overvalued with our detailed analysis, featuring fair value estimates, potential risks, dividends, insider trades, and its financial condition.
Access Free AnalysisHave feedback on this article? Concerned about the content? Get in touch with us directly. Alternatively, email editorial-team (at) simplywallst.com.This article by Simply Wall St is general in nature. We provide commentary based on historical data and analyst forecasts only using an unbiased methodology and our articles are not intended to be financial advice. It does not constitute a recommendation to buy or sell any stock, and does not take account of your objectives, or your financial situation. We aim to bring you long-term focused analysis driven by fundamental data. Note that our analysis may not factor in the latest price-sensitive company announcements or qualitative material. Simply Wall St has no position in any stocks mentioned.
Disclaimer: Investing carries risk. This is not financial advice. The above content should not be regarded as an offer, recommendation, or solicitation on acquiring or disposing of any financial products, any associated discussions, comments, or posts by author or other users should not be considered as such either. It is solely for general information purpose only, which does not consider your own investment objectives, financial situations or needs. TTM assumes no responsibility or warranty for the accuracy and completeness of the information, investors should do their own research and may seek professional advice before investing.
Most Discussed
- 1
- 2
- 3
- 4
- 5
- 6
- 7
- 8
- 9
- 10