Private companies in Powerwin Tech Group Limited (HKG:2405) are its biggest bettors, and their bets paid off as stock gained 10% last week
Key Insights
- The considerable ownership by private companies in Powerwin Tech Group indicates that they collectively have a greater say in management and business strategy
- The top 2 shareholders own 56% of the company
- Recent sales by insiders
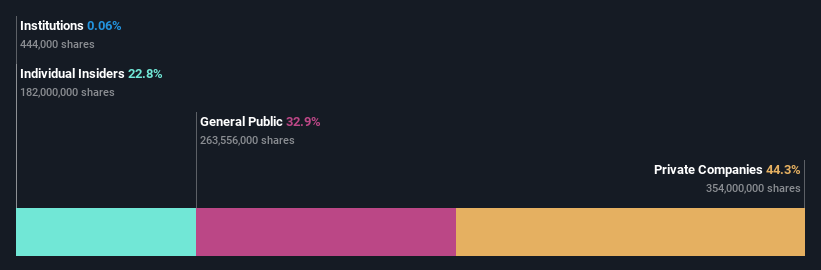
If you want to know who really controls Powerwin Tech Group Limited (HKG:2405), then you'll have to look at the makeup of its share registry. With 44% stake, private companies possess the maximum shares in the company. In other words, the group stands to gain the most (or lose the most) from their investment into the company.
As a result, private companies collectively scored the highest last week as the company hit HK$2.1b market cap following a 10% gain in the stock.
Let's delve deeper into each type of owner of Powerwin Tech Group, beginning with the chart below.
Check out our latest analysis for Powerwin Tech Group
What Does The Lack Of Institutional Ownership Tell Us About Powerwin Tech Group?
Small companies that are not very actively traded often lack institutional investors, but it's less common to see large companies without them.
There are multiple explanations for why institutions don't own a stock. The most common is that the company is too small relative to funds under management, so the institution does not bother to look closely at the company. It is also possible that fund managers don't own the stock because they aren't convinced it will perform well. Powerwin Tech Group might not have the sort of past performance institutions are looking for, or perhaps they simply have not studied the business closely.
We note that hedge funds don't have a meaningful investment in Powerwin Tech Group. Looking at our data, we can see that the largest shareholder is Common Excellence International Group Limited with 44% of shares outstanding. For context, the second largest shareholder holds about 12% of the shares outstanding, followed by an ownership of 10.0% by the third-largest shareholder. Xiang Li, who is the third-largest shareholder, also happens to hold the title of Chairman of the Board.
To make our study more interesting, we found that the top 2 shareholders have a majority ownership in the company, meaning that they are powerful enough to influence the decisions of the company.
While it makes sense to study institutional ownership data for a company, it also makes sense to study analyst sentiments to know which way the wind is blowing. Our information suggests that there isn't any analyst coverage of the stock, so it is probably little known.
Insider Ownership Of Powerwin Tech Group
The definition of company insiders can be subjective and does vary between jurisdictions. Our data reflects individual insiders, capturing board members at the very least. Company management run the business, but the CEO will answer to the board, even if he or she is a member of it.
I generally consider insider ownership to be a good thing. However, on some occasions it makes it more difficult for other shareholders to hold the board accountable for decisions.
It seems insiders own a significant proportion of Powerwin Tech Group Limited. Insiders have a HK$488m stake in this HK$2.1b business. It is great to see insiders so invested in the business. It might be worth checking if those insiders have been buying recently.
General Public Ownership
With a 33% ownership, the general public, mostly comprising of individual investors, have some degree of sway over Powerwin Tech Group. While this size of ownership may not be enough to sway a policy decision in their favour, they can still make a collective impact on company policies.
Private Company Ownership
It seems that Private Companies own 44%, of the Powerwin Tech Group stock. Private companies may be related parties. Sometimes insiders have an interest in a public company through a holding in a private company, rather than in their own capacity as an individual. While it's hard to draw any broad stroke conclusions, it is worth noting as an area for further research.
Next Steps:
It's always worth thinking about the different groups who own shares in a company. But to understand Powerwin Tech Group better, we need to consider many other factors. For example, we've discovered 3 warning signs for Powerwin Tech Group (2 make us uncomfortable!) that you should be aware of before investing here.
Of course this may not be the best stock to buy. Therefore, you may wish to see our free collection of interesting prospects boasting favorable financials.
NB: Figures in this article are calculated using data from the last twelve months, which refer to the 12-month period ending on the last date of the month the financial statement is dated. This may not be consistent with full year annual report figures.
New: Manage All Your Stock Portfolios in One Place
We've created the ultimate portfolio companion for stock investors, and it's free.
• Connect an unlimited number of Portfolios and see your total in one currency• Be alerted to new Warning Signs or Risks via email or mobile• Track the Fair Value of your stocks
Try a Demo Portfolio for FreeHave feedback on this article? Concerned about the content? Get in touch with us directly. Alternatively, email editorial-team (at) simplywallst.com.This article by Simply Wall St is general in nature. We provide commentary based on historical data and analyst forecasts only using an unbiased methodology and our articles are not intended to be financial advice. It does not constitute a recommendation to buy or sell any stock, and does not take account of your objectives, or your financial situation. We aim to bring you long-term focused analysis driven by fundamental data. Note that our analysis may not factor in the latest price-sensitive company announcements or qualitative material. Simply Wall St has no position in any stocks mentioned.
Disclaimer: Investing carries risk. This is not financial advice. The above content should not be regarded as an offer, recommendation, or solicitation on acquiring or disposing of any financial products, any associated discussions, comments, or posts by author or other users should not be considered as such either. It is solely for general information purpose only, which does not consider your own investment objectives, financial situations or needs. TTM assumes no responsibility or warranty for the accuracy and completeness of the information, investors should do their own research and may seek professional advice before investing.
Most Discussed
- 1
- 2
- 3
- 4
- 5
- 6
- 7
- 8
- 9
- 10