Metcash Limited's (ASX:MTS) Stock Been Rising: Are Strong Financials Guiding The Market?
Most readers would already know that Metcash's (ASX:MTS) stock increased by 3.9% over the past three months. Since the market usually pay for a company’s long-term financial health, we decided to study the company’s fundamentals to see if they could be influencing the market. Particularly, we will be paying attention to Metcash's ROE today.
ROE or return on equity is a useful tool to assess how effectively a company can generate returns on the investment it received from its shareholders. Simply put, it is used to assess the profitability of a company in relation to its equity capital.
Check out our latest analysis for Metcash
How Do You Calculate Return On Equity?
The formula for return on equity is:
Return on Equity = Net Profit (from continuing operations) ÷ Shareholders' Equity
So, based on the above formula, the ROE for Metcash is:
16% = AU$258m ÷ AU$1.6b (Based on the trailing twelve months to October 2024).
The 'return' is the income the business earned over the last year. Another way to think of that is that for every A$1 worth of equity, the company was able to earn A$0.16 in profit.
What Has ROE Got To Do With Earnings Growth?
We have already established that ROE serves as an efficient profit-generating gauge for a company's future earnings. Depending on how much of these profits the company reinvests or "retains", and how effectively it does so, we are then able to assess a company’s earnings growth potential. Assuming everything else remains unchanged, the higher the ROE and profit retention, the higher the growth rate of a company compared to companies that don't necessarily bear these characteristics.
Metcash's Earnings Growth And 16% ROE
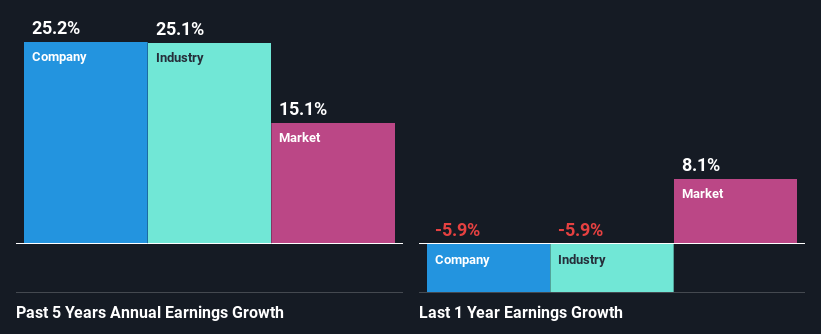
At first glance, Metcash seems to have a decent ROE. And on comparing with the industry, we found that the the average industry ROE is similar at 14%. This probably goes some way in explaining Metcash's significant 25% net income growth over the past five years amongst other factors. However, there could also be other drivers behind this growth. For example, it is possible that the company's management has made some good strategic decisions, or that the company has a low payout ratio.
We then performed a comparison between Metcash's net income growth with the industry, which revealed that the company's growth is similar to the average industry growth of 25% in the same 5-year period.
Earnings growth is a huge factor in stock valuation. The investor should try to establish if the expected growth or decline in earnings, whichever the case may be, is priced in. By doing so, they will have an idea if the stock is headed into clear blue waters or if swampy waters await. If you're wondering about Metcash's's valuation, check out this gauge of its price-to-earnings ratio, as compared to its industry.
Is Metcash Efficiently Re-investing Its Profits?
Metcash has a significant three-year median payout ratio of 83%, meaning the company only retains 17% of its income. This implies that the company has been able to achieve high earnings growth despite returning most of its profits to shareholders.
Besides, Metcash has been paying dividends for at least ten years or more. This shows that the company is committed to sharing profits with its shareholders. Based on the latest analysts' estimates, we found that the company's future payout ratio over the next three years is expected to hold steady at 71%. As a result, Metcash's ROE is not expected to change by much either, which we inferred from the analyst estimate of 18% for future ROE.
Conclusion
Overall, we are quite pleased with Metcash's performance. In particular, its high ROE is quite noteworthy and also the probable explanation behind its considerable earnings growth. Yet, the company is retaining a small portion of its profits. Which means that the company has been able to grow its earnings in spite of it, so that's not too bad. That being so, a study of the latest analyst forecasts show that the company is expected to see a slowdown in its future earnings growth. Are these analysts expectations based on the broad expectations for the industry, or on the company's fundamentals? Click here to be taken to our analyst's forecasts page for the company.
New: Manage All Your Stock Portfolios in One Place
We've created the ultimate portfolio companion for stock investors, and it's free.
• Connect an unlimited number of Portfolios and see your total in one currency• Be alerted to new Warning Signs or Risks via email or mobile• Track the Fair Value of your stocks
Try a Demo Portfolio for FreeHave feedback on this article? Concerned about the content? Get in touch with us directly. Alternatively, email editorial-team (at) simplywallst.com.This article by Simply Wall St is general in nature. We provide commentary based on historical data and analyst forecasts only using an unbiased methodology and our articles are not intended to be financial advice. It does not constitute a recommendation to buy or sell any stock, and does not take account of your objectives, or your financial situation. We aim to bring you long-term focused analysis driven by fundamental data. Note that our analysis may not factor in the latest price-sensitive company announcements or qualitative material. Simply Wall St has no position in any stocks mentioned.
Disclaimer: Investing carries risk. This is not financial advice. The above content should not be regarded as an offer, recommendation, or solicitation on acquiring or disposing of any financial products, any associated discussions, comments, or posts by author or other users should not be considered as such either. It is solely for general information purpose only, which does not consider your own investment objectives, financial situations or needs. TTM assumes no responsibility or warranty for the accuracy and completeness of the information, investors should do their own research and may seek professional advice before investing.
Most Discussed
- 1
- 2
- 3
- 4
- 5
- 6
- 7
- 8
- 9
- 10