Uniphar And Two Other Promising Penny Stocks To Watch
Global markets have been experiencing a turbulent period, with U.S. stocks falling amid geopolitical tensions and concerns over consumer spending, while European markets show cautious optimism despite mixed economic signals. In such uncertain times, investors often look beyond the major indices for opportunities that might be overlooked by the broader market. Penny stocks, typically representing smaller or newer companies, offer a unique investment avenue; they may carry an outdated name but still hold potential for growth at lower price points. This article will explore three penny stocks that stand out due to their strong financial foundations and potential for long-term value creation.
Top 10 Penny Stocks
| Name | Share Price | Market Cap | Financial Health Rating |
| DXN Holdings Bhd (KLSE:DXN) | MYR0.515 | MYR2.56B | ★★★★★★ |
| Datasonic Group Berhad (KLSE:DSONIC) | MYR0.32 | MYR890.29M | ★★★★★★ |
| Bosideng International Holdings (SEHK:3998) | HK$3.86 | HK$44.31B | ★★★★★★ |
| T.A.C. Consumer (SET:TACC) | THB4.22 | THB2.53B | ★★★★★★ |
| Warpaint London (AIM:W7L) | £4.00 | £323.15M | ★★★★★★ |
| Hil Industries Berhad (KLSE:HIL) | MYR0.855 | MYR283.81M | ★★★★★★ |
| Foresight Group Holdings (LSE:FSG) | £4.00 | £455.98M | ★★★★★★ |
| Next 15 Group (AIM:NFG) | £3.185 | £316.77M | ★★★★☆☆ |
| Embark Early Education (ASX:EVO) | A$0.795 | A$145.87M | ★★★★☆☆ |
| Polar Capital Holdings (AIM:POLR) | £4.865 | £468.97M | ★★★★★★ |
Click here to see the full list of 5,706 stocks from our Penny Stocks screener.
Underneath we present a selection of stocks filtered out by our screen.
Uniphar (ISE:UPR)
Simply Wall St Financial Health Rating: ★★★★☆☆
Overview: Uniphar plc is a diversified healthcare services company operating in the Republic of Ireland, the United Kingdom, The Netherlands, and internationally with a market cap of €649.78 million.
Operations: The company generates revenue through three main segments: Pharma (€657.34 million), Medtech (€252.93 million), and Supply Chain & Retail (€1.77 billion).
Market Cap: €649.78M
Uniphar plc, with a market cap of €649.78 million, operates in diverse healthcare segments generating significant revenues. Despite a high net debt to equity ratio of 41.1%, its debt is well covered by operating cash flow and interest payments are adequately managed with EBIT coverage at 3.4 times. The company's earnings have grown at an average rate of 17.2% per year over the past five years, although recent growth has slowed to 1.4%. Analysts predict a substantial stock price increase, despite current volatility being higher than most Irish stocks and profit margins slightly declining from last year.
- Get an in-depth perspective on Uniphar's performance by reading our balance sheet health report here.
- Explore Uniphar's analyst forecasts in our growth report.
Tian An Medicare (SEHK:383)
Simply Wall St Financial Health Rating: ★★★★★★
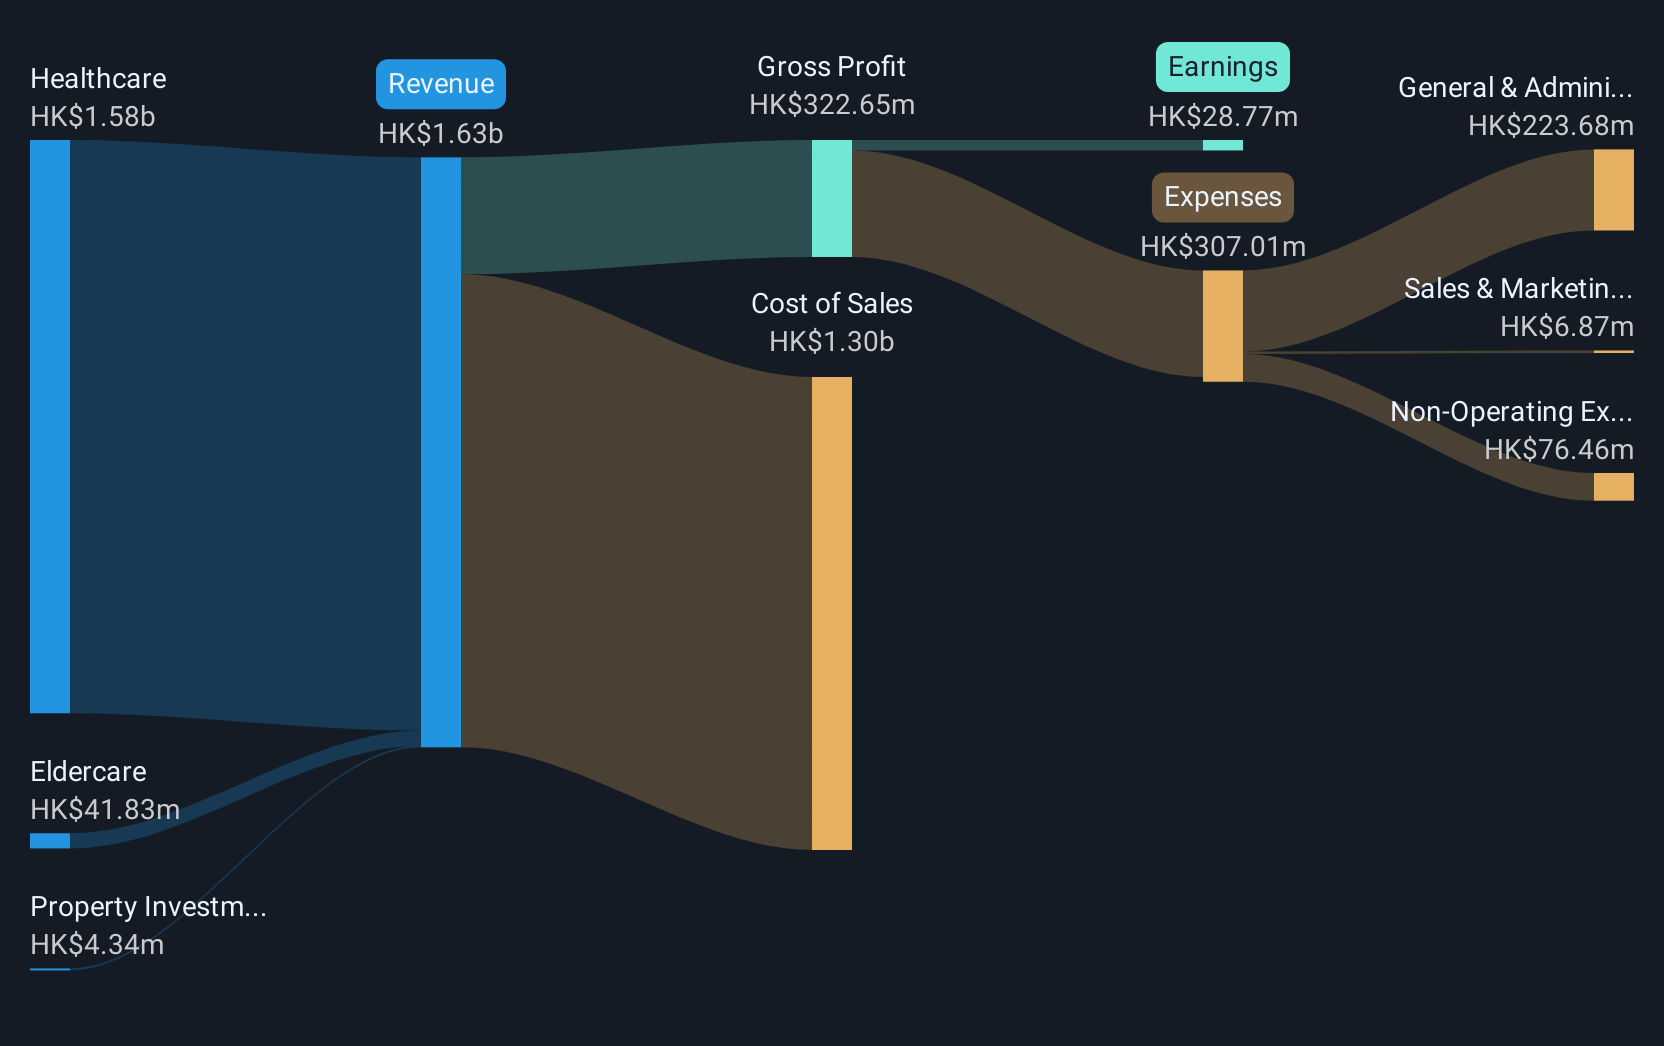
Overview: Tian An Medicare Limited is an investment holding company that primarily operates hospitals in the People's Republic of China and Hong Kong, with a market cap of HK$813.61 million.
Operations: The company generates revenue from its healthcare segment at HK$1.59 billion, eldercare services at HK$37.71 million, and property investment activities at HK$3.34 million.
Market Cap: HK$813.61M
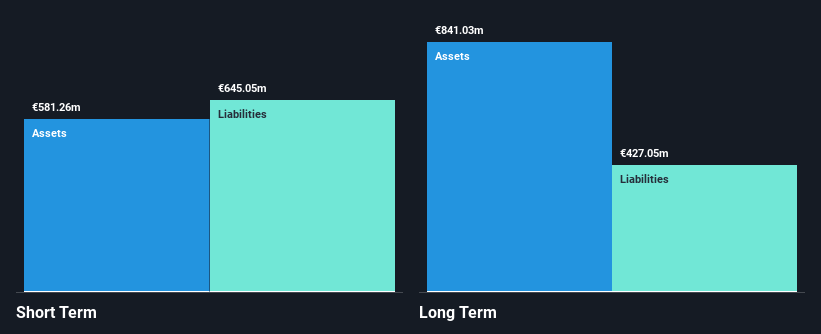
Tian An Medicare Limited, with a market cap of HK$813.61 million, has recently become profitable, showing strong earnings growth over the past five years. Its debt management is robust, with interest payments well-covered by EBIT and operating cash flow effectively covering its debt. The company’s short-term assets exceed both its short- and long-term liabilities, highlighting sound financial health. Despite high volatility in share price over recent months and a low return on equity at 2.4%, Tian An's stock trades significantly below estimated fair value. Recent board changes may impact strategic direction but introduce experienced governance expertise.
- Jump into the full analysis health report here for a deeper understanding of Tian An Medicare.
- Gain insights into Tian An Medicare's past trends and performance with our report on the company's historical track record.
Sichuan Shengda Forestry Industry (SZSE:002259)
Simply Wall St Financial Health Rating: ★★★★☆☆
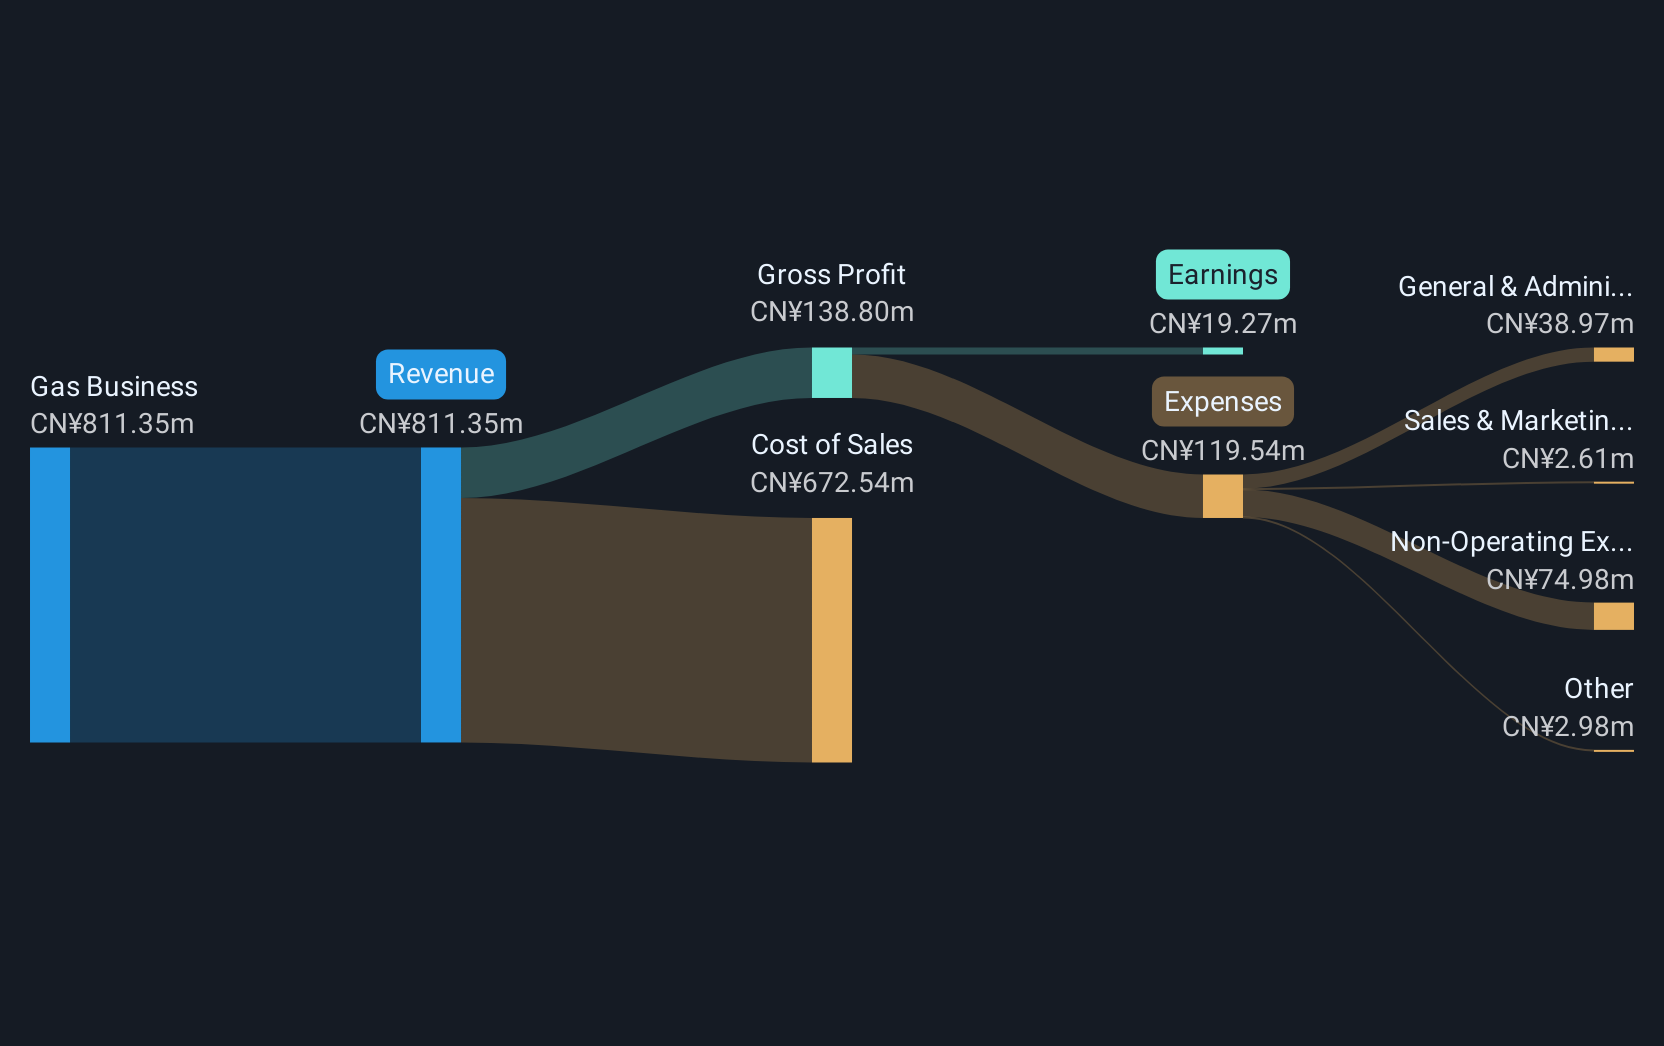
Overview: Sichuan Shengda Forestry Industry Co., Ltd is involved in the production and sale of liquefied natural gas (LNG) in China, with a market cap of CN¥1.93 billion.
Operations: The company's revenue is primarily derived from its gas business, which generated CN¥685.80 million.
Market Cap: CN¥1.93B
Sichuan Shengda Forestry Industry, with a market cap of CN¥1.93 billion, is focused on its LNG business in China, generating CN¥685.80 million in revenue. Despite being unprofitable, the company has managed to maintain stable weekly volatility at 5% and has not diluted shareholders significantly over the past year. It holds more cash than debt and boasts a positive free cash flow that supports a cash runway exceeding three years. However, its debt-to-equity ratio has increased over five years from 34.8% to 61%, and short-term assets do not cover long-term liabilities of CN¥450.2 million.
- Click here and access our complete financial health analysis report to understand the dynamics of Sichuan Shengda Forestry Industry.
- Examine Sichuan Shengda Forestry Industry's past performance report to understand how it has performed in prior years.
Taking Advantage
- Embark on your investment journey to our 5,706 Penny Stocks selection here.
- Invested in any of these stocks? Simplify your portfolio management with Simply Wall St and stay ahead with our alerts for any critical updates on your stocks.
- Streamline your investment strategy with Simply Wall St's app for free and benefit from extensive research on stocks across all corners of the world.
Interested In Other Possibilities?
- Explore high-performing small cap companies that haven't yet garnered significant analyst attention.
- Jump on the AI train with fast growing tech companies forging a new era of innovation.
- Find companies with promising cash flow potential yet trading below their fair value.
This article by Simply Wall St is general in nature. We provide commentary based on historical data and analyst forecasts only using an unbiased methodology and our articles are not intended to be financial advice. It does not constitute a recommendation to buy or sell any stock, and does not take account of your objectives, or your financial situation. We aim to bring you long-term focused analysis driven by fundamental data. Note that our analysis may not factor in the latest price-sensitive company announcements or qualitative material. Simply Wall St has no position in any stocks mentioned.
Valuation is complex, but we're here to simplify it.
Discover if Tian An Medicare might be undervalued or overvalued with our detailed analysis, featuring fair value estimates, potential risks, dividends, insider trades, and its financial condition.
Access Free AnalysisHave feedback on this article? Concerned about the content? Get in touch with us directly. Alternatively, email editorial-team@simplywallst.com
Disclaimer: Investing carries risk. This is not financial advice. The above content should not be regarded as an offer, recommendation, or solicitation on acquiring or disposing of any financial products, any associated discussions, comments, or posts by author or other users should not be considered as such either. It is solely for general information purpose only, which does not consider your own investment objectives, financial situations or needs. TTM assumes no responsibility or warranty for the accuracy and completeness of the information, investors should do their own research and may seek professional advice before investing.
Most Discussed
- 1
- 2
- 3
- 4
- 5
- 6
- 7
- 8
- 9
- 10