Finding a business that has the potential to grow substantially is not easy, but it is possible if we look at a few key financial metrics. Typically, we'll want to notice a trend of growing return on capital employed (ROCE) and alongside that, an expanding base of capital employed. Put simply, these types of businesses are compounding machines, meaning they are continually reinvesting their earnings at ever-higher rates of return. Having said that, while the ROCE is currently high for Karrie International Holdings (HKG:1050), we aren't jumping out of our chairs because returns are decreasing.
Return On Capital Employed (ROCE): What Is It?
Just to clarify if you're unsure, ROCE is a metric for evaluating how much pre-tax income (in percentage terms) a company earns on the capital invested in its business. To calculate this metric for Karrie International Holdings, this is the formula:
Return on Capital Employed = Earnings Before Interest and Tax (EBIT) ÷ (Total Assets - Current Liabilities)
0.25 = HK$302m ÷ (HK$2.6b - HK$1.4b) (Based on the trailing twelve months to September 2024).
Therefore, Karrie International Holdings has an ROCE of 25%. In absolute terms that's a great return and it's even better than the Electronic industry average of 7.2%.
View our latest analysis for Karrie International Holdings
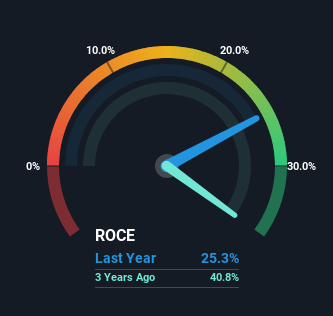
In the above chart we have measured Karrie International Holdings' prior ROCE against its prior performance, but the future is arguably more important. If you'd like, you can check out the forecasts from the analysts covering Karrie International Holdings for free.
So How Is Karrie International Holdings' ROCE Trending?
We've noticed that although returns on capital are flat over the last five years, the amount of capital employed in the business has fallen 33% in that same period. This indicates to us that assets are being sold and thus the business is likely shrinking, which you'll remember isn't the typical ingredients for an up-and-coming multi-bagger. But we have to give it to Karrie International Holdings because the returns on the capital it is employing are still high in relative terms.
On another note, while the change in ROCE trend might not scream for attention, it's interesting that the current liabilities have actually gone up over the last five years. This is intriguing because if current liabilities hadn't increased to 55% of total assets, this reported ROCE would probably be less than25% because total capital employed would be higher.The 25% ROCE could be even lower if current liabilities weren't 55% of total assets, because the the formula would show a larger base of total capital employed. Additionally, this high level of current liabilities isn't ideal because it means the company's suppliers (or short-term creditors) are effectively funding a large portion of the business.
In Conclusion...
Overall, we're not ecstatic to see Karrie International Holdings reducing the amount of capital it employs in the business. Since the stock has gained an impressive 56% over the last five years, investors must think there's better things to come. But if the trajectory of these underlying trends continue, we think the likelihood of it being a multi-bagger from here isn't high.
If you'd like to know about the risks facing Karrie International Holdings, we've discovered 2 warning signs that you should be aware of.
Karrie International Holdings is not the only stock earning high returns. If you'd like to see more, check out our free list of companies earning high returns on equity with solid fundamentals.
Valuation is complex, but we're here to simplify it.
Discover if Karrie International Holdings might be undervalued or overvalued with our detailed analysis, featuring fair value estimates, potential risks, dividends, insider trades, and its financial condition.
Access Free AnalysisHave feedback on this article? Concerned about the content? Get in touch with us directly. Alternatively, email editorial-team (at) simplywallst.com.This article by Simply Wall St is general in nature. We provide commentary based on historical data and analyst forecasts only using an unbiased methodology and our articles are not intended to be financial advice. It does not constitute a recommendation to buy or sell any stock, and does not take account of your objectives, or your financial situation. We aim to bring you long-term focused analysis driven by fundamental data. Note that our analysis may not factor in the latest price-sensitive company announcements or qualitative material. Simply Wall St has no position in any stocks mentioned.