Can Mixed Fundamentals Have A Negative Impact on Dowell Service Group Co. Limited (HKG:2352) Current Share Price Momentum?
Dowell Service Group (HKG:2352) has had a great run on the share market with its stock up by a significant 13% over the last three months. But the company's key financial indicators appear to be differing across the board and that makes us question whether or not the company's current share price momentum can be maintained. Specifically, we decided to study Dowell Service Group's ROE in this article.
Return on equity or ROE is a key measure used to assess how efficiently a company's management is utilizing the company's capital. In other words, it is a profitability ratio which measures the rate of return on the capital provided by the company's shareholders.
See our latest analysis for Dowell Service Group
How Is ROE Calculated?
ROE can be calculated by using the formula:
Return on Equity = Net Profit (from continuing operations) ÷ Shareholders' Equity
So, based on the above formula, the ROE for Dowell Service Group is:
4.4% = CN¥22m ÷ CN¥500m (Based on the trailing twelve months to June 2024).
The 'return' is the yearly profit. So, this means that for every HK$1 of its shareholder's investments, the company generates a profit of HK$0.04.
What Is The Relationship Between ROE And Earnings Growth?
Thus far, we have learned that ROE measures how efficiently a company is generating its profits. We now need to evaluate how much profit the company reinvests or "retains" for future growth which then gives us an idea about the growth potential of the company. Generally speaking, other things being equal, firms with a high return on equity and profit retention, have a higher growth rate than firms that don’t share these attributes.
Dowell Service Group's Earnings Growth And 4.4% ROE
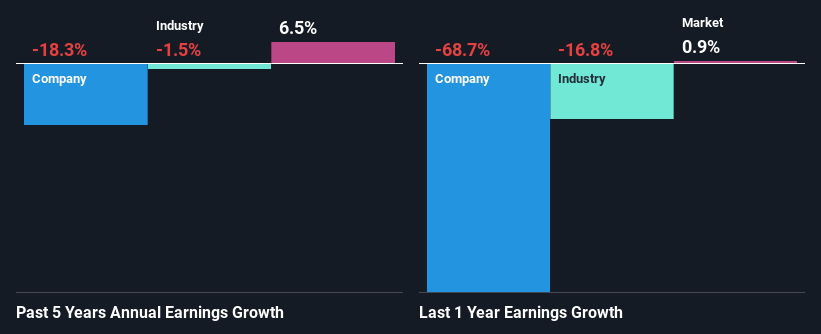
As you can see, Dowell Service Group's ROE looks pretty weak. An industry comparison shows that the company's ROE is not much different from the industry average of 5.2% either. Given the low ROE Dowell Service Group's five year net income decline of 18% is not surprising.
As a next step, we compared Dowell Service Group's performance with the industry and found thatDowell Service Group's performance is depressing even when compared with the industry, which has shrunk its earnings at a rate of 1.5% in the same period, which is a slower than the company.
Earnings growth is a huge factor in stock valuation. It’s important for an investor to know whether the market has priced in the company's expected earnings growth (or decline). This then helps them determine if the stock is placed for a bright or bleak future. One good indicator of expected earnings growth is the P/E ratio which determines the price the market is willing to pay for a stock based on its earnings prospects. So, you may want to check if Dowell Service Group is trading on a high P/E or a low P/E, relative to its industry.
Is Dowell Service Group Making Efficient Use Of Its Profits?
When we piece together Dowell Service Group's low three-year median payout ratio of 16% (where it is retaining 84% of its profits), calculated for the last three-year period, we are puzzled by the lack of growth. The low payout should mean that the company is retaining most of its earnings and consequently, should see some growth. So there could be some other explanations in that regard. For example, the company's business may be deteriorating.
Only recently, Dowell Service Group stated paying a dividend. This likely means that the management might have concluded that its shareholders have a strong preference for dividends.
Conclusion
Overall, we have mixed feelings about Dowell Service Group. While the company does have a high rate of reinvestment, the low ROE means that all that reinvestment is not reaping any benefit to its investors, and moreover, its having a negative impact on the earnings growth. Wrapping up, we would proceed with caution with this company and one way of doing that would be to look at the risk profile of the business. You can see the 3 risks we have identified for Dowell Service Group by visiting our risks dashboard for free on our platform here.
New: Manage All Your Stock Portfolios in One Place
We've created the ultimate portfolio companion for stock investors, and it's free.
• Connect an unlimited number of Portfolios and see your total in one currency• Be alerted to new Warning Signs or Risks via email or mobile• Track the Fair Value of your stocks
Try a Demo Portfolio for FreeHave feedback on this article? Concerned about the content? Get in touch with us directly. Alternatively, email editorial-team (at) simplywallst.com.This article by Simply Wall St is general in nature. We provide commentary based on historical data and analyst forecasts only using an unbiased methodology and our articles are not intended to be financial advice. It does not constitute a recommendation to buy or sell any stock, and does not take account of your objectives, or your financial situation. We aim to bring you long-term focused analysis driven by fundamental data. Note that our analysis may not factor in the latest price-sensitive company announcements or qualitative material. Simply Wall St has no position in any stocks mentioned.
Disclaimer: Investing carries risk. This is not financial advice. The above content should not be regarded as an offer, recommendation, or solicitation on acquiring or disposing of any financial products, any associated discussions, comments, or posts by author or other users should not be considered as such either. It is solely for general information purpose only, which does not consider your own investment objectives, financial situations or needs. TTM assumes no responsibility or warranty for the accuracy and completeness of the information, investors should do their own research and may seek professional advice before investing.
Most Discussed
- 1
- 2
- 3
- 4
- 5
- 6
- 7
- 8
- 9
- 10