Could The Market Be Wrong About Sarepta Therapeutics, Inc. (NASDAQ:SRPT) Given Its Attractive Financial Prospects?
It is hard to get excited after looking at Sarepta Therapeutics' (NASDAQ:SRPT) recent performance, when its stock has declined 49% over the past three months. However, stock prices are usually driven by a company’s financial performance over the long term, which in this case looks quite promising. Specifically, we decided to study Sarepta Therapeutics' ROE in this article.
Return on equity or ROE is a key measure used to assess how efficiently a company's management is utilizing the company's capital. In short, ROE shows the profit each dollar generates with respect to its shareholder investments.
This technology could replace computers: discover the 20 stocks are working to make quantum computing a reality.
How Do You Calculate Return On Equity?
The formula for ROE is:
Return on Equity = Net Profit (from continuing operations) ÷ Shareholders' Equity
So, based on the above formula, the ROE for Sarepta Therapeutics is:
15% = US$235m ÷ US$1.5b (Based on the trailing twelve months to December 2024).
The 'return' is the profit over the last twelve months. One way to conceptualize this is that for each $1 of shareholders' capital it has, the company made $0.15 in profit.
See our latest analysis for Sarepta Therapeutics
Why Is ROE Important For Earnings Growth?
So far, we've learned that ROE is a measure of a company's profitability. We now need to evaluate how much profit the company reinvests or "retains" for future growth which then gives us an idea about the growth potential of the company. Assuming all else is equal, companies that have both a higher return on equity and higher profit retention are usually the ones that have a higher growth rate when compared to companies that don't have the same features.
Sarepta Therapeutics' Earnings Growth And 15% ROE
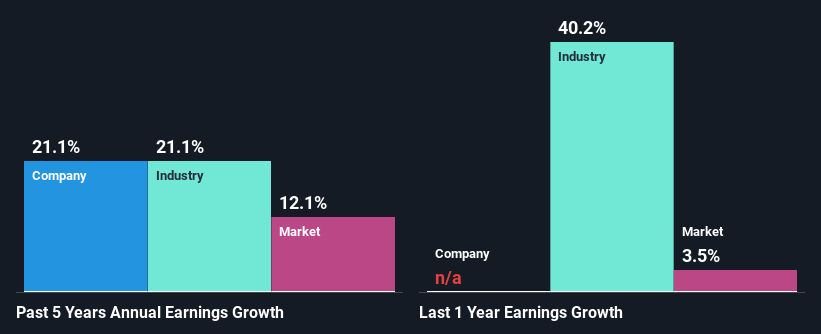
To begin with, Sarepta Therapeutics seems to have a respectable ROE. And on comparing with the industry, we found that the the average industry ROE is similar at 15%. This probably goes some way in explaining Sarepta Therapeutics' significant 21% net income growth over the past five years amongst other factors. We believe that there might also be other aspects that are positively influencing the company's earnings growth. Such as - high earnings retention or an efficient management in place.
We then performed a comparison between Sarepta Therapeutics' net income growth with the industry, which revealed that the company's growth is similar to the average industry growth of 21% in the same 5-year period.
Earnings growth is an important metric to consider when valuing a stock. What investors need to determine next is if the expected earnings growth, or the lack of it, is already built into the share price. Doing so will help them establish if the stock's future looks promising or ominous. Is Sarepta Therapeutics fairly valued compared to other companies? These 3 valuation measures might help you decide.
Is Sarepta Therapeutics Efficiently Re-investing Its Profits?
Sarepta Therapeutics doesn't pay any regular dividends currently which essentially means that it has been reinvesting all of its profits into the business. This definitely contributes to the high earnings growth number that we discussed above.
Summary
In total, we are pretty happy with Sarepta Therapeutics' performance. In particular, it's great to see that the company is investing heavily into its business and along with a high rate of return, that has resulted in a sizeable growth in its earnings. We also studied the latest analyst forecasts and found that the company's earnings growth is expected be similar to its current growth rate. To know more about the company's future earnings growth forecasts take a look at this free report on analyst forecasts for the company to find out more.
New: Manage All Your Stock Portfolios in One Place
We've created the ultimate portfolio companion for stock investors, and it's free.
• Connect an unlimited number of Portfolios and see your total in one currency• Be alerted to new Warning Signs or Risks via email or mobile• Track the Fair Value of your stocks
Try a Demo Portfolio for FreeHave feedback on this article? Concerned about the content? Get in touch with us directly. Alternatively, email editorial-team (at) simplywallst.com.This article by Simply Wall St is general in nature. We provide commentary based on historical data and analyst forecasts only using an unbiased methodology and our articles are not intended to be financial advice. It does not constitute a recommendation to buy or sell any stock, and does not take account of your objectives, or your financial situation. We aim to bring you long-term focused analysis driven by fundamental data. Note that our analysis may not factor in the latest price-sensitive company announcements or qualitative material. Simply Wall St has no position in any stocks mentioned.
Disclaimer: Investing carries risk. This is not financial advice. The above content should not be regarded as an offer, recommendation, or solicitation on acquiring or disposing of any financial products, any associated discussions, comments, or posts by author or other users should not be considered as such either. It is solely for general information purpose only, which does not consider your own investment objectives, financial situations or needs. TTM assumes no responsibility or warranty for the accuracy and completeness of the information, investors should do their own research and may seek professional advice before investing.
Most Discussed
- 1
- 2
- 3
- 4
- 5
- 6
- 7
- 8
- 9
- 10