Benign Growth For Dubber Corporation Limited (ASX:DUB) Underpins Stock's 26% Plummet
Unfortunately for some shareholders, the Dubber Corporation Limited (ASX:DUB) share price has dived 26% in the last thirty days, prolonging recent pain. To make matters worse, the recent drop has wiped out a year's worth of gains with the share price now back where it started a year ago.
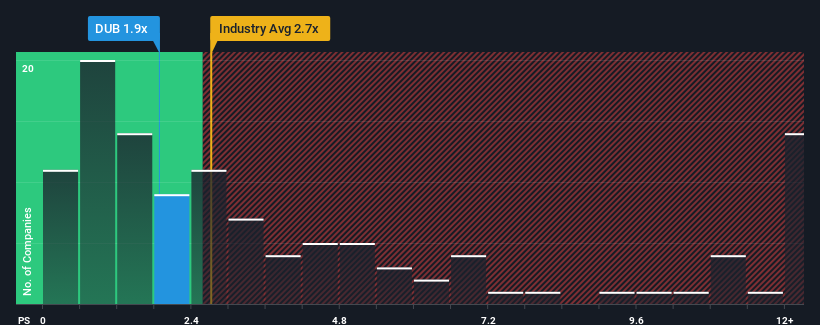
Since its price has dipped substantially, Dubber may be sending bullish signals at the moment with its price-to-sales (or "P/S") ratio of 1.9x, since almost half of all companies in the Software industry in Australia have P/S ratios greater than 2.7x and even P/S higher than 7x are not unusual. Nonetheless, we'd need to dig a little deeper to determine if there is a rational basis for the reduced P/S.
Trump has pledged to "unleash" American oil and gas and these 15 US stocks have developments that are poised to benefit.
See our latest analysis for Dubber
How Has Dubber Performed Recently?
The revenue growth achieved at Dubber over the last year would be more than acceptable for most companies. Perhaps the market is expecting this acceptable revenue performance to take a dive, which has kept the P/S suppressed. If that doesn't eventuate, then existing shareholders have reason to be optimistic about the future direction of the share price.
We don't have analyst forecasts, but you can see how recent trends are setting up the company for the future by checking out our free report on Dubber's earnings, revenue and cash flow.What Are Revenue Growth Metrics Telling Us About The Low P/S?
The only time you'd be truly comfortable seeing a P/S as low as Dubber's is when the company's growth is on track to lag the industry.
If we review the last year of revenue growth, the company posted a terrific increase of 17%. The latest three year period has also seen an excellent 39% overall rise in revenue, aided by its short-term performance. So we can start by confirming that the company has done a great job of growing revenue over that time.
Comparing the recent medium-term revenue trends against the industry's one-year growth forecast of 21% shows it's noticeably less attractive.
In light of this, it's understandable that Dubber's P/S sits below the majority of other companies. It seems most investors are expecting to see the recent limited growth rates continue into the future and are only willing to pay a reduced amount for the stock.
What Does Dubber's P/S Mean For Investors?
Dubber's recently weak share price has pulled its P/S back below other Software companies. Generally, our preference is to limit the use of the price-to-sales ratio to establishing what the market thinks about the overall health of a company.
In line with expectations, Dubber maintains its low P/S on the weakness of its recent three-year growth being lower than the wider industry forecast. Right now shareholders are accepting the low P/S as they concede future revenue probably won't provide any pleasant surprises. If recent medium-term revenue trends continue, it's hard to see the share price experience a reversal of fortunes anytime soon.
Don't forget that there may be other risks. For instance, we've identified 4 warning signs for Dubber (2 are a bit unpleasant) you should be aware of.
If you're unsure about the strength of Dubber's business, why not explore our interactive list of stocks with solid business fundamentals for some other companies you may have missed.
If you're looking to trade Dubber, open an account with the lowest-cost platform trusted by professionals, Interactive Brokers.
With clients in over 200 countries and territories, and access to 160 markets, IBKR lets you trade stocks, options, futures, forex, bonds and funds from a single integrated account.
Enjoy no hidden fees, no account minimums, and FX conversion rates as low as 0.03%, far better than what most brokers offer.
Sponsored ContentNew: Manage All Your Stock Portfolios in One Place
We've created the ultimate portfolio companion for stock investors, and it's free.
• Connect an unlimited number of Portfolios and see your total in one currency• Be alerted to new Warning Signs or Risks via email or mobile• Track the Fair Value of your stocks
Try a Demo Portfolio for FreeHave feedback on this article? Concerned about the content? Get in touch with us directly. Alternatively, email editorial-team (at) simplywallst.com.This article by Simply Wall St is general in nature. We provide commentary based on historical data and analyst forecasts only using an unbiased methodology and our articles are not intended to be financial advice. It does not constitute a recommendation to buy or sell any stock, and does not take account of your objectives, or your financial situation. We aim to bring you long-term focused analysis driven by fundamental data. Note that our analysis may not factor in the latest price-sensitive company announcements or qualitative material. Simply Wall St has no position in any stocks mentioned.
Disclaimer: Investing carries risk. This is not financial advice. The above content should not be regarded as an offer, recommendation, or solicitation on acquiring or disposing of any financial products, any associated discussions, comments, or posts by author or other users should not be considered as such either. It is solely for general information purpose only, which does not consider your own investment objectives, financial situations or needs. TTM assumes no responsibility or warranty for the accuracy and completeness of the information, investors should do their own research and may seek professional advice before investing.
Most Discussed
- 1
- 2
- 3
- 4
- 5
- 6
- 7
- 8
- 9
- 10