Is Vulcan Steel (ASX:VSL) A Risky Investment?
Howard Marks put it nicely when he said that, rather than worrying about share price volatility, 'The possibility of permanent loss is the risk I worry about... and every practical investor I know worries about.' When we think about how risky a company is, we always like to look at its use of debt, since debt overload can lead to ruin. We can see that Vulcan Steel Limited (ASX:VSL) does use debt in its business. But should shareholders be worried about its use of debt?
AI is about to change healthcare. These 20 stocks are working on everything from early diagnostics to drug discovery. The best part - they are all under $10bn in marketcap - there is still time to get in early.
When Is Debt A Problem?
Generally speaking, debt only becomes a real problem when a company can't easily pay it off, either by raising capital or with its own cash flow. If things get really bad, the lenders can take control of the business. However, a more usual (but still expensive) situation is where a company must dilute shareholders at a cheap share price simply to get debt under control. By replacing dilution, though, debt can be an extremely good tool for businesses that need capital to invest in growth at high rates of return. When we examine debt levels, we first consider both cash and debt levels, together.
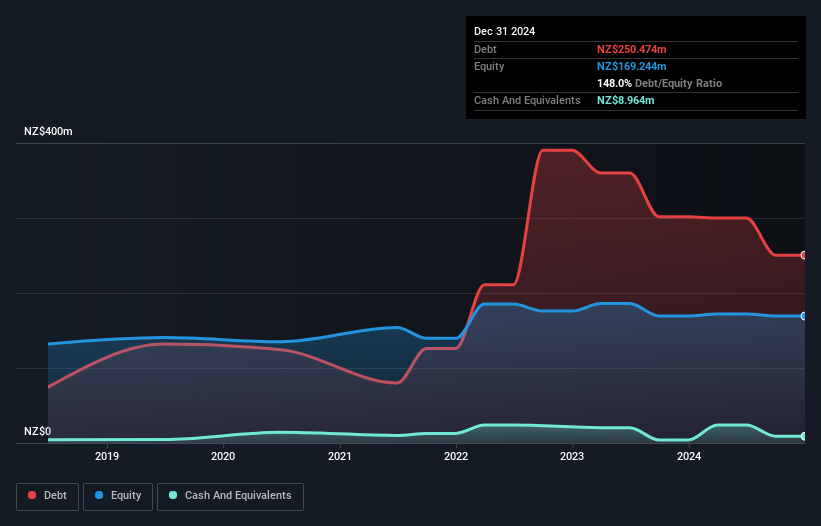
What Is Vulcan Steel's Debt?
You can click the graphic below for the historical numbers, but it shows that Vulcan Steel had NZ$250.5m of debt in December 2024, down from NZ$301.6m, one year before. However, because it has a cash reserve of NZ$8.96m, its net debt is less, at about NZ$241.5m.
A Look At Vulcan Steel's Liabilities
Zooming in on the latest balance sheet data, we can see that Vulcan Steel had liabilities of NZ$199.1m due within 12 months and liabilities of NZ$508.8m due beyond that. Offsetting these obligations, it had cash of NZ$8.96m as well as receivables valued at NZ$129.3m due within 12 months. So its liabilities total NZ$569.7m more than the combination of its cash and short-term receivables.
While this might seem like a lot, it is not so bad since Vulcan Steel has a market capitalization of NZ$1.02b, and so it could probably strengthen its balance sheet by raising capital if it needed to. But we definitely want to keep our eyes open to indications that its debt is bringing too much risk.
See our latest analysis for Vulcan Steel
We use two main ratios to inform us about debt levels relative to earnings. The first is net debt divided by earnings before interest, tax, depreciation, and amortization (EBITDA), while the second is how many times its earnings before interest and tax (EBIT) covers its interest expense (or its interest cover, for short). Thus we consider debt relative to earnings both with and without depreciation and amortization expenses.
While we wouldn't worry about Vulcan Steel's net debt to EBITDA ratio of 2.7, we think its super-low interest cover of 2.1 times is a sign of high leverage. So shareholders should probably be aware that interest expenses appear to have really impacted the business lately. Even worse, Vulcan Steel saw its EBIT tank 48% over the last 12 months. If earnings continue to follow that trajectory, paying off that debt load will be harder than convincing us to run a marathon in the rain. There's no doubt that we learn most about debt from the balance sheet. But it is future earnings, more than anything, that will determine Vulcan Steel's ability to maintain a healthy balance sheet going forward. So if you want to see what the professionals think, you might find this free report on analyst profit forecasts to be interesting.
Finally, a company can only pay off debt with cold hard cash, not accounting profits. So we always check how much of that EBIT is translated into free cash flow. Over the most recent three years, Vulcan Steel recorded free cash flow worth 73% of its EBIT, which is around normal, given free cash flow excludes interest and tax. This free cash flow puts the company in a good position to pay down debt, when appropriate.
Our View
On the face of it, Vulcan Steel's interest cover left us tentative about the stock, and its EBIT growth rate was no more enticing than the one empty restaurant on the busiest night of the year. But on the bright side, its conversion of EBIT to free cash flow is a good sign, and makes us more optimistic. Looking at the balance sheet and taking into account all these factors, we do believe that debt is making Vulcan Steel stock a bit risky. That's not necessarily a bad thing, but we'd generally feel more comfortable with less leverage. When analysing debt levels, the balance sheet is the obvious place to start. However, not all investment risk resides within the balance sheet - far from it. For instance, we've identified 4 warning signs for Vulcan Steel (1 doesn't sit too well with us) you should be aware of.
If you're interested in investing in businesses that can grow profits without the burden of debt, then check out this free list of growing businesses that have net cash on the balance sheet.
If you're looking to trade Vulcan Steel, open an account with the lowest-cost platform trusted by professionals, Interactive Brokers.
With clients in over 200 countries and territories, and access to 160 markets, IBKR lets you trade stocks, options, futures, forex, bonds and funds from a single integrated account.
Enjoy no hidden fees, no account minimums, and FX conversion rates as low as 0.03%, far better than what most brokers offer.
Sponsored ContentNew: Manage All Your Stock Portfolios in One Place
We've created the ultimate portfolio companion for stock investors, and it's free.
• Connect an unlimited number of Portfolios and see your total in one currency• Be alerted to new Warning Signs or Risks via email or mobile• Track the Fair Value of your stocks
Try a Demo Portfolio for FreeHave feedback on this article? Concerned about the content? Get in touch with us directly. Alternatively, email editorial-team (at) simplywallst.com.This article by Simply Wall St is general in nature. We provide commentary based on historical data and analyst forecasts only using an unbiased methodology and our articles are not intended to be financial advice. It does not constitute a recommendation to buy or sell any stock, and does not take account of your objectives, or your financial situation. We aim to bring you long-term focused analysis driven by fundamental data. Note that our analysis may not factor in the latest price-sensitive company announcements or qualitative material. Simply Wall St has no position in any stocks mentioned.
Disclaimer: Investing carries risk. This is not financial advice. The above content should not be regarded as an offer, recommendation, or solicitation on acquiring or disposing of any financial products, any associated discussions, comments, or posts by author or other users should not be considered as such either. It is solely for general information purpose only, which does not consider your own investment objectives, financial situations or needs. TTM assumes no responsibility or warranty for the accuracy and completeness of the information, investors should do their own research and may seek professional advice before investing.
Most Discussed
- 1
- 2
- 3
- 4
- 5
- 6
- 7
- 8
- 9
- 10