Market Participants Recognise AustAsia Group Ltd.'s (HKG:2425) Revenues Pushing Shares 25% Higher
Despite an already strong run, AustAsia Group Ltd. (HKG:2425) shares have been powering on, with a gain of 25% in the last thirty days. Looking back a bit further, it's encouraging to see the stock is up 32% in the last year.
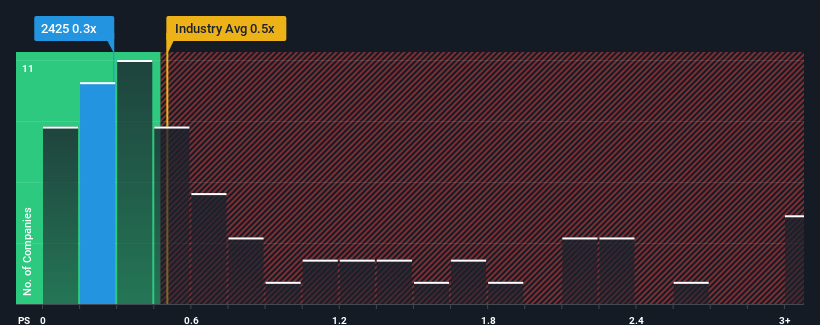
Even after such a large jump in price, there still wouldn't be many who think AustAsia Group's price-to-sales (or "P/S") ratio of 0.3x is worth a mention when the median P/S in Hong Kong's Food industry is similar at about 0.5x. While this might not raise any eyebrows, if the P/S ratio is not justified investors could be missing out on a potential opportunity or ignoring looming disappointment.
AI is about to change healthcare. These 20 stocks are working on everything from early diagnostics to drug discovery. The best part - they are all under $10bn in marketcap - there is still time to get in early.
See our latest analysis for AustAsia Group
What Does AustAsia Group's Recent Performance Look Like?
For example, consider that AustAsia Group's financial performance has been poor lately as its revenue has been in decline. It might be that many expect the company to put the disappointing revenue performance behind them over the coming period, which has kept the P/S from falling. If you like the company, you'd at least be hoping this is the case so that you could potentially pick up some stock while it's not quite in favour.
We don't have analyst forecasts, but you can see how recent trends are setting up the company for the future by checking out our free report on AustAsia Group's earnings, revenue and cash flow.What Are Revenue Growth Metrics Telling Us About The P/S?
There's an inherent assumption that a company should be matching the industry for P/S ratios like AustAsia Group's to be considered reasonable.
In reviewing the last year of financials, we were disheartened to see the company's revenues fell to the tune of 6.1%. That put a dampener on the good run it was having over the longer-term as its three-year revenue growth is still a noteworthy 11% in total. So we can start by confirming that the company has generally done a good job of growing revenue over that time, even though it had some hiccups along the way.
Weighing that recent medium-term revenue trajectory against the broader industry's one-year forecast for expansion of 5.3% shows it's about the same on an annualised basis.
In light of this, it's understandable that AustAsia Group's P/S sits in line with the majority of other companies. Apparently shareholders are comfortable to simply hold on assuming the company will continue keeping a low profile.
What We Can Learn From AustAsia Group's P/S?
AustAsia Group appears to be back in favour with a solid price jump bringing its P/S back in line with other companies in the industry Generally, our preference is to limit the use of the price-to-sales ratio to establishing what the market thinks about the overall health of a company.
It appears to us that AustAsia Group maintains its moderate P/S off the back of its recent three-year growth being in line with the wider industry forecast. With previous revenue trends that keep up with the current industry outlook, it's hard to justify the company's P/S ratio deviating much from it's current point. Given the current circumstances, it seems improbable that the share price will experience any significant movement in either direction in the near future if recent medium-term revenue trends persist.
There are also other vital risk factors to consider before investing and we've discovered 2 warning signs for AustAsia Group that you should be aware of.
Of course, profitable companies with a history of great earnings growth are generally safer bets. So you may wish to see this free collection of other companies that have reasonable P/E ratios and have grown earnings strongly.
New: Manage All Your Stock Portfolios in One Place
We've created the ultimate portfolio companion for stock investors, and it's free.
• Connect an unlimited number of Portfolios and see your total in one currency• Be alerted to new Warning Signs or Risks via email or mobile• Track the Fair Value of your stocks
Try a Demo Portfolio for FreeHave feedback on this article? Concerned about the content? Get in touch with us directly. Alternatively, email editorial-team (at) simplywallst.com.This article by Simply Wall St is general in nature. We provide commentary based on historical data and analyst forecasts only using an unbiased methodology and our articles are not intended to be financial advice. It does not constitute a recommendation to buy or sell any stock, and does not take account of your objectives, or your financial situation. We aim to bring you long-term focused analysis driven by fundamental data. Note that our analysis may not factor in the latest price-sensitive company announcements or qualitative material. Simply Wall St has no position in any stocks mentioned.
Disclaimer: Investing carries risk. This is not financial advice. The above content should not be regarded as an offer, recommendation, or solicitation on acquiring or disposing of any financial products, any associated discussions, comments, or posts by author or other users should not be considered as such either. It is solely for general information purpose only, which does not consider your own investment objectives, financial situations or needs. TTM assumes no responsibility or warranty for the accuracy and completeness of the information, investors should do their own research and may seek professional advice before investing.
Most Discussed
- 1
- 2
- 3
- 4
- 5
- 6
- 7
- 8
- 9
- 10