Has HealthStream, Inc.'s (NASDAQ:HSTM) Impressive Stock Performance Got Anything to Do With Its Fundamentals?
Most readers would already be aware that HealthStream's (NASDAQ:HSTM) stock increased significantly by 5.7% over the past week. As most would know, fundamentals are what usually guide market price movements over the long-term, so we decided to look at the company's key financial indicators today to determine if they have any role to play in the recent price movement. Specifically, we decided to study HealthStream's ROE in this article.
Return on equity or ROE is a key measure used to assess how efficiently a company's management is utilizing the company's capital. In short, ROE shows the profit each dollar generates with respect to its shareholder investments.
We've found 21 US stocks that are forecast to pay a dividend yield of over 6% next year. See the full list for free.
How Do You Calculate Return On Equity?
ROE can be calculated by using the formula:
Return on Equity = Net Profit (from continuing operations) ÷ Shareholders' Equity
So, based on the above formula, the ROE for HealthStream is:
5.6% = US$20m ÷ US$359m (Based on the trailing twelve months to December 2024).
The 'return' is the profit over the last twelve months. Another way to think of that is that for every $1 worth of equity, the company was able to earn $0.06 in profit.
See our latest analysis for HealthStream
What Is The Relationship Between ROE And Earnings Growth?
Thus far, we have learned that ROE measures how efficiently a company is generating its profits. We now need to evaluate how much profit the company reinvests or "retains" for future growth which then gives us an idea about the growth potential of the company. Assuming everything else remains unchanged, the higher the ROE and profit retention, the higher the growth rate of a company compared to companies that don't necessarily bear these characteristics.
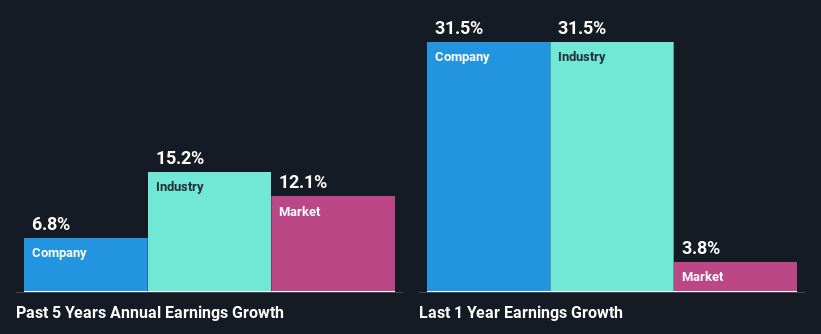
A Side By Side comparison of HealthStream's Earnings Growth And 5.6% ROE
At first glance, HealthStream's ROE doesn't look very promising. However, its ROE is similar to the industry average of 5.6%, so we won't completely dismiss the company. On the other hand, HealthStream reported a moderate 6.8% net income growth over the past five years. Given the slightly low ROE, it is likely that there could be some other aspects that are driving this growth. For instance, the company has a low payout ratio or is being managed efficiently.
As a next step, we compared HealthStream's net income growth with the industry and were disappointed to see that the company's growth is lower than the industry average growth of 15% in the same period.
The basis for attaching value to a company is, to a great extent, tied to its earnings growth. It’s important for an investor to know whether the market has priced in the company's expected earnings growth (or decline). By doing so, they will have an idea if the stock is headed into clear blue waters or if swampy waters await. What is HSTM worth today? The intrinsic value infographic in our free research report helps visualize whether HSTM is currently mispriced by the market.
Is HealthStream Using Its Retained Earnings Effectively?
HealthStream's three-year median payout ratio to shareholders is 17% (implying that it retains 83% of its income), which is on the lower side, so it seems like the management is reinvesting profits heavily to grow its business.
While HealthStream has been growing its earnings, it only recently started to pay dividends which likely means that the company decided to impress new and existing shareholders with a dividend. Our latest analyst data shows that the future payout ratio of the company over the next three years is expected to be approximately 16%.
Conclusion
On the whole, we do feel that HealthStream has some positive attributes. That is, a decent growth in earnings backed by a high rate of reinvestment. However, we do feel that that earnings growth could have been higher if the business were to improve on the low ROE rate. Especially given how the company is reinvesting a huge chunk of its profits. Having said that, the company's earnings growth is expected to slow down, as forecasted in the current analyst estimates. To know more about the company's future earnings growth forecasts take a look at this free report on analyst forecasts for the company to find out more.
Valuation is complex, but we're here to simplify it.
Discover if HealthStream might be undervalued or overvalued with our detailed analysis, featuring fair value estimates, potential risks, dividends, insider trades, and its financial condition.
Access Free AnalysisHave feedback on this article? Concerned about the content? Get in touch with us directly. Alternatively, email editorial-team (at) simplywallst.com.This article by Simply Wall St is general in nature. We provide commentary based on historical data and analyst forecasts only using an unbiased methodology and our articles are not intended to be financial advice. It does not constitute a recommendation to buy or sell any stock, and does not take account of your objectives, or your financial situation. We aim to bring you long-term focused analysis driven by fundamental data. Note that our analysis may not factor in the latest price-sensitive company announcements or qualitative material. Simply Wall St has no position in any stocks mentioned.
Disclaimer: Investing carries risk. This is not financial advice. The above content should not be regarded as an offer, recommendation, or solicitation on acquiring or disposing of any financial products, any associated discussions, comments, or posts by author or other users should not be considered as such either. It is solely for general information purpose only, which does not consider your own investment objectives, financial situations or needs. TTM assumes no responsibility or warranty for the accuracy and completeness of the information, investors should do their own research and may seek professional advice before investing.
Most Discussed
- 1
- 2
- 3
- 4
- 5
- 6
- 7
- 8
- 9
- 10