Ethereum price eyes $2,000 as spot ETH ETFs buck worrying trend 5 seconds ago
The Ethereum price bounced back this week as investors bought the dip, and the Fear and Greed Index exited the fear zone.
Ethereum (ETH) rose to $1,800, up 30% from its lowest level this year. The rebound, which coincided with that of other cryptocurrencies, pushed its market cap to almost $220 billion.
There are signs that crypto investors are embracing the fear of missing out, or FOMO. The Crypto Fear and Greed Index has jumped from the extreme fear zone 18 to the neutral point of $53 today. If the trend gains steam, it will enter the greed zone soon.
Further, Wall Street investors are becoming interested in Ethereum as it bucked a worrying trend. All spot ETH ETFs had net inflows of over $157 million, the best performance since February. They had net outflows in the last consecutive weeks, the longest losing streak since their approval.
Ethereum had other positive metrics this week. For example, DEX protocols in the network handled over $11.5 billion in volume, bringing the 30-day volume to $57 billion. The 24-hour volume rose to $1.7 billion, with Uniswap, Curve Finance, Fluid, and Maverick Protocol having the biggest market share.
Ethereum price may continue doing well in the coming days as investors target the psychological point at $2,000. The risk to this outlook is the perpetual futures funding rate has plunged, a sign that short sellers are paying a fee to buyers to maintain their trades.
Ethereum price technical analysis

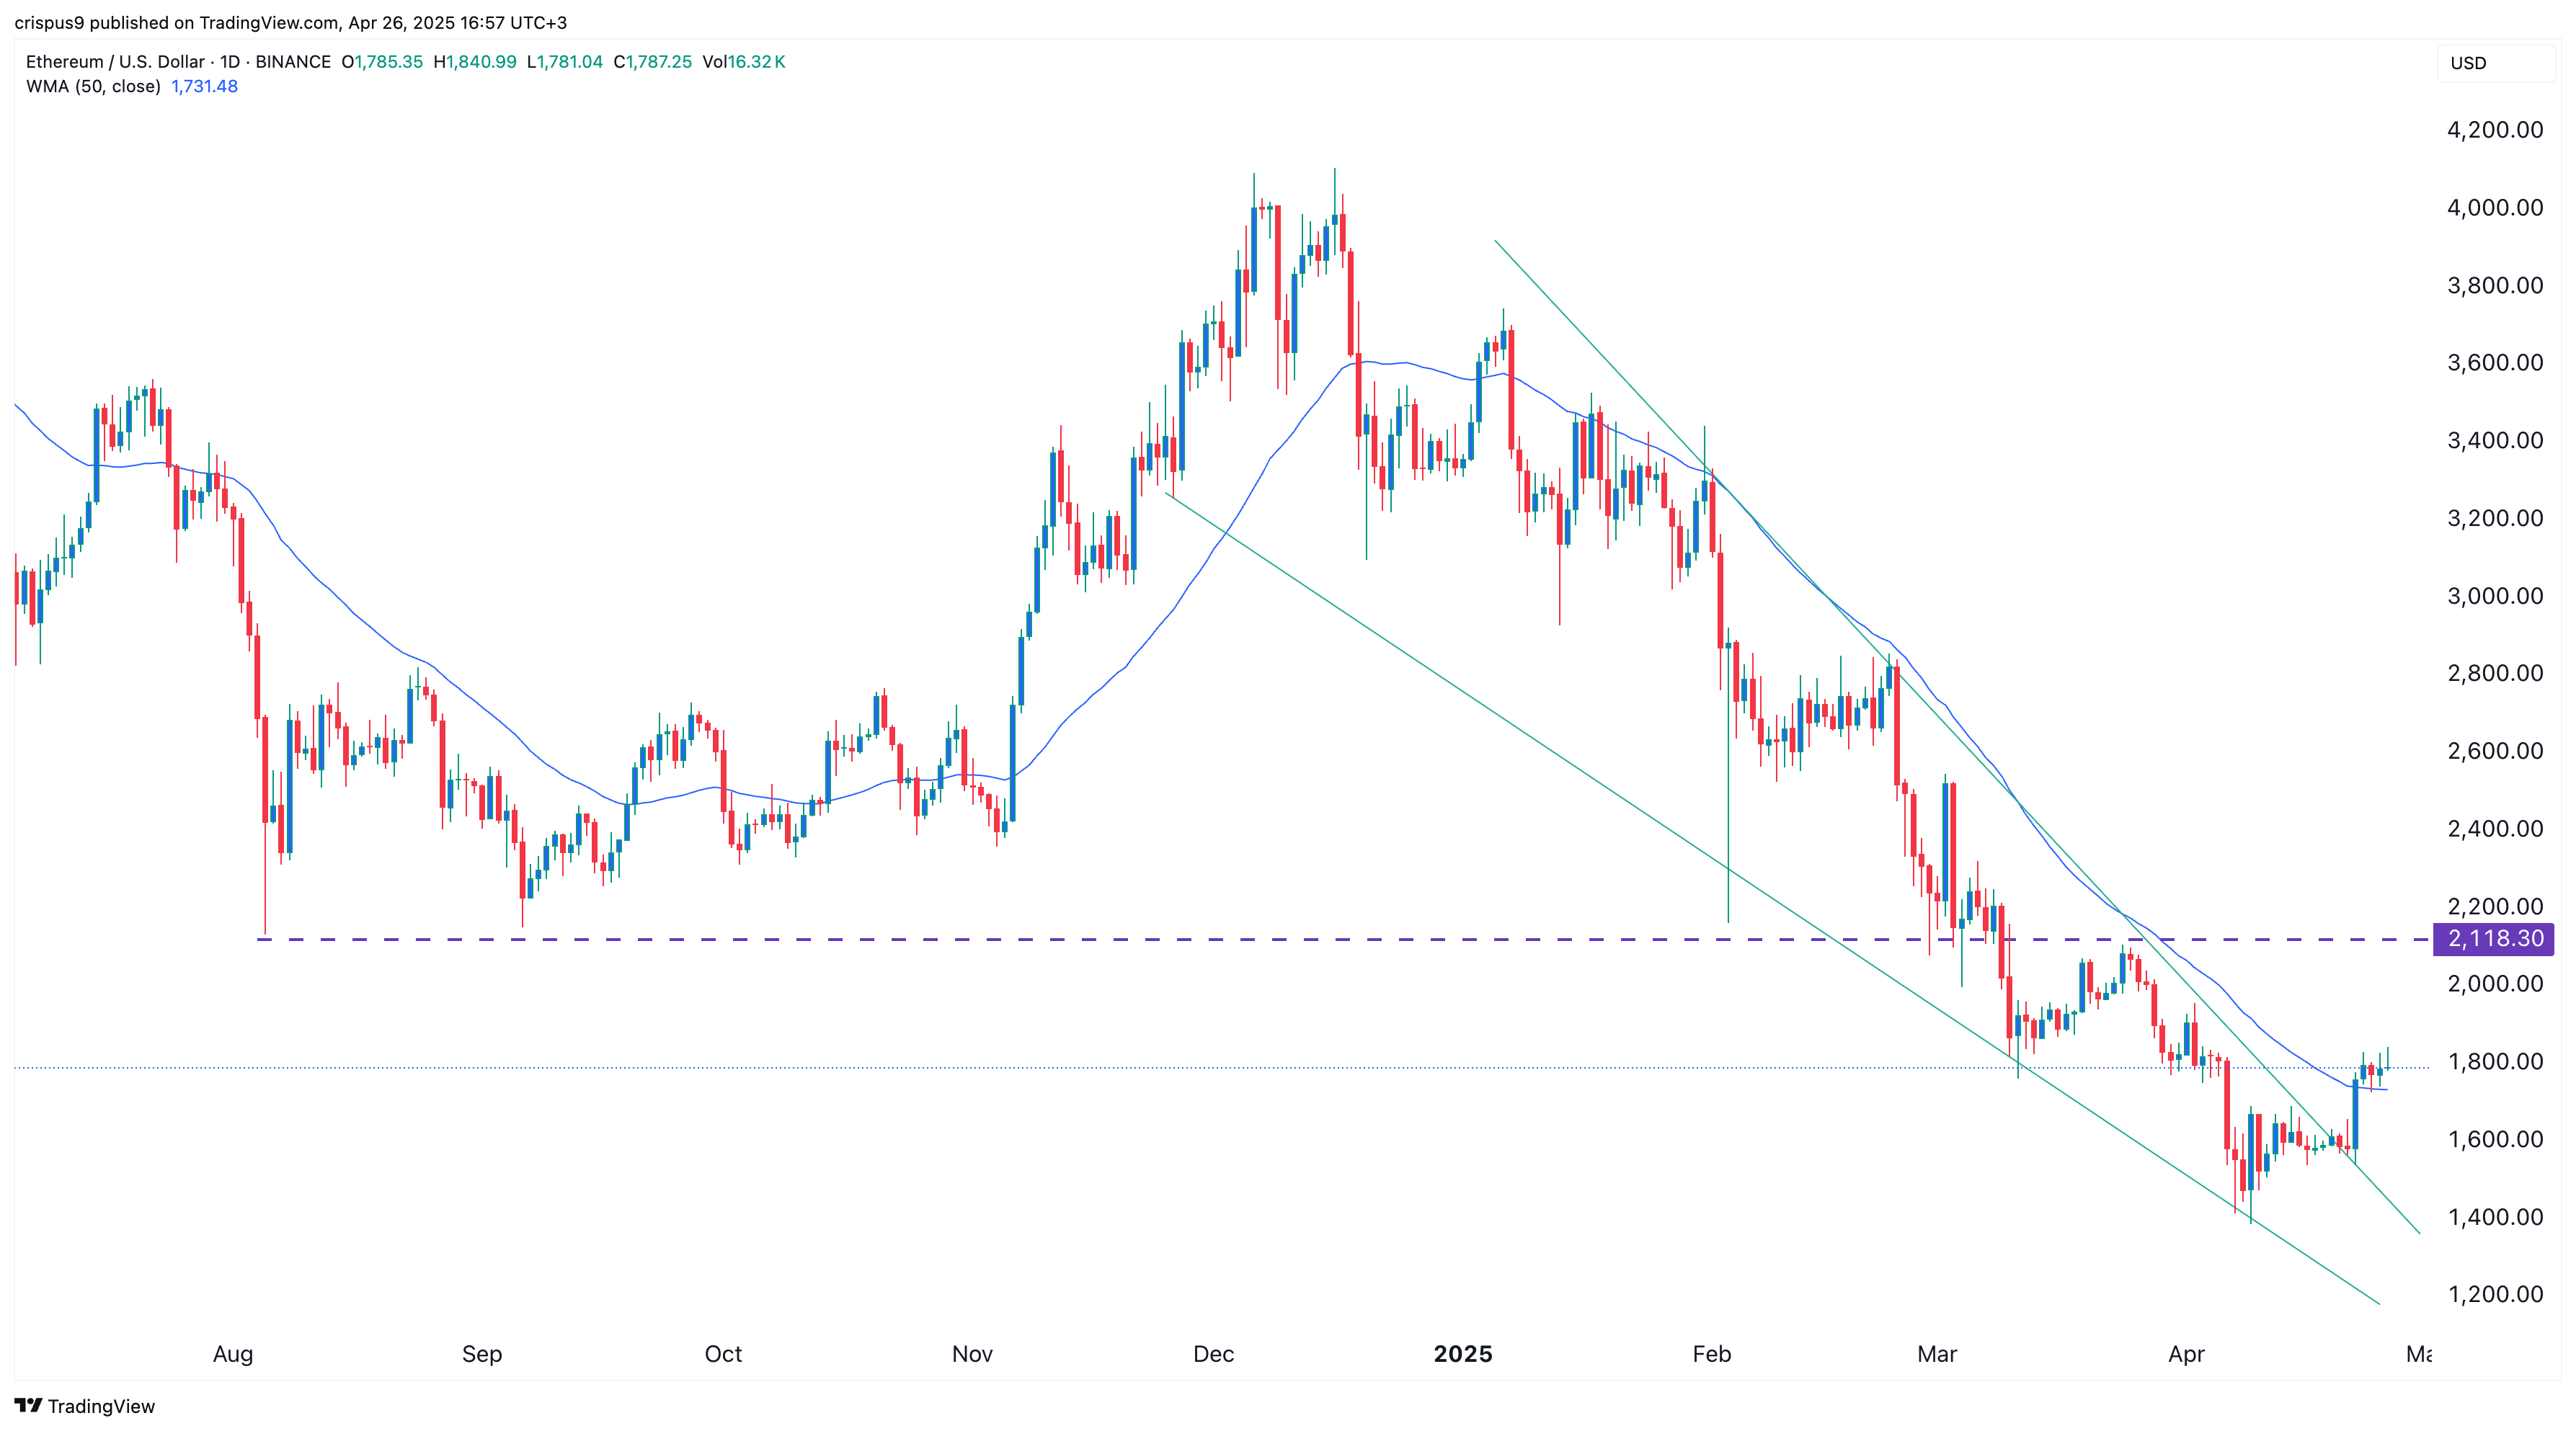
The daily chart shows that the ETH price has rebounded in the past few days. It has jumped and crossed the upper side of the falling wedge chart pattern, a popular bullish reversal sign.
The coin has moved slightly above the 50-day weighted moving average and formed a small bullish flag pattern, a popular bullish continuation sign in the market.
Therefore, the coin will likely continue rising as bulls target the psychological point at $2,000. A complete bullish breakout will be confirmed if the coin jumps above the key resistance at $2,120, the neckline of the triple-bottom pattern that formed on the weekly chart.
Disclaimer: Investing carries risk. This is not financial advice. The above content should not be regarded as an offer, recommendation, or solicitation on acquiring or disposing of any financial products, any associated discussions, comments, or posts by author or other users should not be considered as such either. It is solely for general information purpose only, which does not consider your own investment objectives, financial situations or needs. TTM assumes no responsibility or warranty for the accuracy and completeness of the information, investors should do their own research and may seek professional advice before investing.
Most Discussed
- 1
- 2
- 3
- 4
- 5
- 6
- 7
- 8
- 9
- 10