Why is Bitcoin price stuck in a tight range? 5 seconds ago
Bitcoin’s lack of movement lately isn’t unusual as price action is trapped within a tight lower time frame trading channel. Until either support or resistance is broken with strong volume, expect continued chop, indecision, and frustrating fakeouts for both bulls and bears.
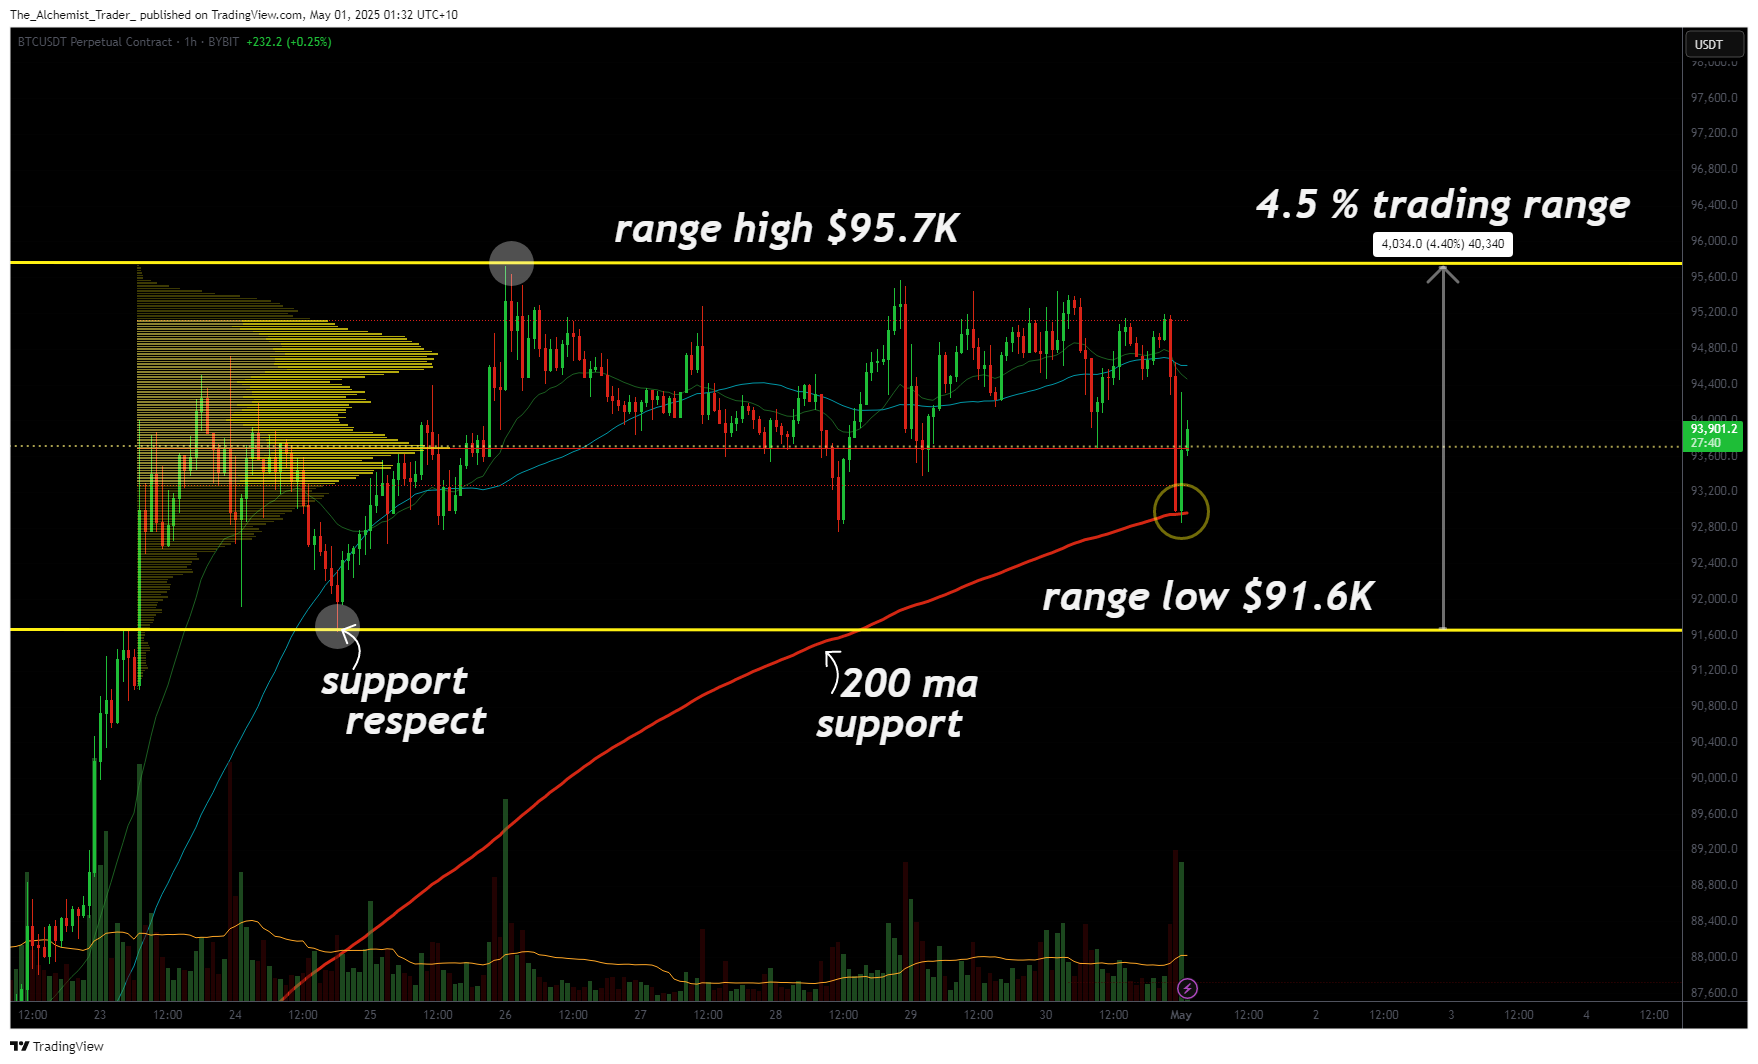
Since April 23rd, Bitcoin (BTC) has been locked in a sideways range between $91,610 support and $95,700 resistance. This range has acted as a short-term zone of price acceptance, and BTC has failed to build momentum beyond either boundary. As long as this structure holds, the market will continue to coil within it, trading between predictable levels with no trend confirmation.
Key technical points
- Range Boundaries: $91,610 (support) and $95,700 (resistance)
- Current Structure: Lower time frame consolidation zone
- Indicators in Play: 200 MA, Point of Control (PoC), VAH/VAL levels

Price action has been largely dictated by key volume zones such as the Value Area High (VAH), Value Area Low (VAL), and the Point of Control (PoC). These levels mark the most traded areas within the range and have created reliable zones for short-term reactions.
Additionally, the 200-period moving average has acted as dynamic support, providing temporary relief to buyers during small dips. A loss of that level would signal weakness and likely initiate a full rotation to the range low.
Despite a few volatile moves on the intraday charts, BTC has failed to follow through with any meaningful breakout. The lack of volume accompanying these attempts confirms ongoing range-bound behavior. From a market structure perspective, the asset is still searching for equilibrium, a fair value zone that satisfies both buyers and sellers.
Why price action is moving like this
This type of chop is typical during periods of consolidation. When price is stuck between well-defined support and resistance, it reflects indecision in the market. There’s no strong fundamental driver right now pushing BTC beyond these levels, and market participants are waiting for confirmation before committing to a direction.
The moment either side of the range breaks, with volume and conviction, will determine the next trend. Until then, we remain in balance, with price action constrained by these local highs and lows.
What to expect in the coming price action
Traders should be on alert for a clean break of either boundary. A breakout above $95,700 backed by strong volume would be a bullish signal, while a loss of $91,610 could trigger a bearish move. Until that happens, Bitcoin is likely to continue oscillating within this well-defined lower time frame channel as it seeks its next trend.
Disclaimer: Investing carries risk. This is not financial advice. The above content should not be regarded as an offer, recommendation, or solicitation on acquiring or disposing of any financial products, any associated discussions, comments, or posts by author or other users should not be considered as such either. It is solely for general information purpose only, which does not consider your own investment objectives, financial situations or needs. TTM assumes no responsibility or warranty for the accuracy and completeness of the information, investors should do their own research and may seek professional advice before investing.
Most Discussed
- 1
- 2
- 3
- 4
- 5
- 6
- 7
- 8
- 9
- 10