U.S. Money Supply Just Made History! But It's a Recent Shift -- the First Since the Great Depression -- That Historically Leads to a Big Move in Stocks.
-
A bout of historic volatility on Wall Street has investors searching for correlative events and data points that might signal which direction stocks will move next.
-
Historical shifts in U.S. M2 money supply point to both promise and potential peril for the U.S. economy and stock market.
-
Time and perspective are the greatest allies investors have.
For more than 100 years, the stock market has been the superior wealth creator. Though other asset classes, such as Treasury bonds, real estate, and commodities, have all nominally appreciated in value over the long run, none have come close to matching the annualized return of stocks.
But just because stocks outperform over numerous decades, it doesn't mean equities move higher in a straight line.
Since mid-February, the mature stock-powered Dow Jones Industrial Average (^DJI 1.39%), benchmark S&P 500 (^GSPC 1.47%), and growth-propelled Nasdaq Composite (^IXIC 1.51%) have all vacillated wildly. The Dow Jones and S&P 500 have both entered correction territory, while the Nasdaq Composite dipped into its first bear market in three years.
Additionally, we've witnessed historic nominal and percentage-based moves in all three indexes. Whereas April 3 and April 4 marked the fifth-largest two-day percentage drop (-10.5%) in 75 years for the S&P 500, April 9 produced the biggest single-session nominal point increases for the Dow, S&P 500, and Nasdaq Composite in their respective histories.

Image source: Getty Images.
When stock market volatility is well above average, investors typically search for data points or correlative events that can accurately forecast what's next for stocks. Though no tool can guarantee which direction the Dow, S&P 500, and Nasdaq will move over the short term, some data points and events offer uncanny correlations with big moves (higher or lower) in stocks.
One such data point recently made history. However, it's what occurred prior to this historical event that points to a big-time move in equities.
U.S. money supply is making history on both ends of the spectrum
Though we've witnessed a number of exceptionally strong correlative events recently, some of which have a 100% success rate (thus far) of forecasting future stock moves, it's U.S. money supply that stands out as particularly intriguing.
While there are five official measures of money supply, the two that usually are most important are M1 and M2. The former is a measure of cash and coins in circulation, as well as demand deposits in a checking account. The best way to think about M1 is as money that can be spent at the drop of a hat.
In comparison, M2 encompasses everything in M1 and adds in money market accounts, savings accounts, and certificates of deposit (CDs) below $100,000. It's still money consumers have access to and can spend, but it requires more effort to get to. It's this figure, M2 money supply, that has been making waves.
Over the very long term, U.S. M2 money supply has moved up and to the right. This is a roundabout way of saying that money supply has been continually expanding over lengthy periods to accommodate a higher number of transactions in the U.S. economy.
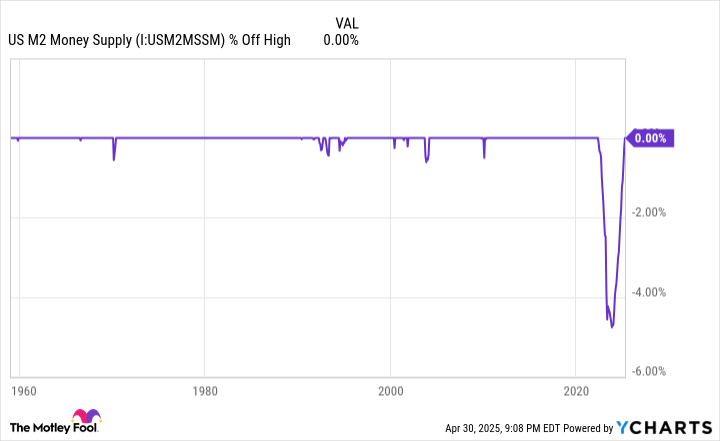
US M2 Money Supply data by YCharts.
In March 2025, U.S. M2 made history by reaching an all-time high of $21.763 trillion. It's the first time M2 achieved a fresh record since April 2022 ($21.75 trillion). With M2 money supply expanding by almost 4% on a year-over-year basis, it would appear the U.S. economy is relatively healthy. But looks can be deceiving.
You'll also note that between April 2022 and October 2023, M2 plunged by a peak of 4.76%. This marked the first time since the Great Depression that M2 contracted by more than 2% on a year-over-year and cumulative basis from a recent high.
It's possible this 4.76% peak-to-trough contraction in M2 money supply was nothing more than a reversion to the mean. During the height of the COVID-19 pandemic, M2 expanded by more than 26% on a year-over-year basis due to fiscal stimulus. Since U.S. money supply had never expanded this quickly in more than 150 years, the subsequent contraction from April 2022 to October 2023 may be relatively benign.
Then again, history shows that when M2 money supply declines by at least 2% on a year-over-year basis, investors should be wary.
WARNING: the Money Supply is officially contracting. 📉This has only happened 4 previous times in last 150 years.Each time a Depression with double-digit unemployment rates followed. 😬 pic.twitter.com/j3FE532oac
-- Nick Gerli (@nickgerli1) March 8, 2023
This post on social media platform X from Reventure Consulting CEO Nick Gerli is more than two years old. The reason it's being presented is because it demonstrates a strong historical correlation between notable declines in M2 money supply and U.S. economic weakness.
When back-tested to 1870, using data from the Federal Reserve and U.S. Census, there have been only five instances where M2 declined by at least 2% on a year-over-year basis: 1878, 1893, 1921, 1931-1933, and 2023. All four prior occurrences coincide with periods of economic depression and double-digit unemployment for the U.S. economy.
The obvious asterisk to these correlations is that things are far different today than they were 92 to 147 years ago. For example, the nation's central bank hadn't even been created in 1878 or 1893. Meanwhile, fiscal and monetary policy knowledge and tools are considerably better today than they were in 1921 and during the Great Depression. This makes it highly unlikely that a depression and double-digit unemployment would manifest in modern times.
Nevertheless, the steepest drop in M2 since the Great Depression does leave the door open for a U.S. recession to take shape. The initial gross domestic product reading for the first quarter showed a 0.3% contraction.
Corporate earnings growth normally weakens during periods of recession, which in turn weighs down stock valuations. Based on an analysis from Bank of America Global Research, approximately two-thirds of the S&P 500's peak-to-trough drawdowns occur after an official recession is declared.

Image source: Getty Images.
Time and perspective can be every investor's silver lining
While notable moves lower in M2 have historically not boded well for investors -- and it could be argued that we're already witnessing some of these "big moves" in stocks right now -- there's a considerably more important silver lining among all of this. It has to do with time and perspective, which are investors' best friends.
On one hand, there are negative events that we can't control. No matter how much we wish recessions and stock market corrections never occurred, these are normal, healthy, and inevitable aspects of the respective economic and investing cycles. On the other, there's a well-defined nonlinearity to economic and stock market cycles that favors investors willing to take a step back and widen their lens.
Since World War II ended nearly 80 years ago, the U.S. economy has worked its way through a dozen recessions. The average length of these economic downturns is around 10 months, with none surpassing 18 months in length. This compares to the average period of economic growth lasting around five years.
This disparity between optimism and pessimism is also easy to see on Wall Street if you look at the big picture.
It's official. A new bull market is confirmed.The S&P 500 is now up 20% from its 10/12/22 closing low. The prior bear market saw the index fall 25.4% over 282 days.Read more at https://t.co/H4p1RcpfIn. pic.twitter.com/tnRz1wdonp
-- Bespoke (@bespokeinvest) June 8, 2023
In June 2023, the analysts at Bespoke Investment Group published this dataset to X, which compared the calendar-day length of every S&P 500 bull and bear market dating back to the start of the Great Depression in September 1929.
Bespoke's calculations show the average bear market resolved in 286 calendar days, or less than 10 months. In comparison, the typical bull market endured for 1,011 calendar days over nearly 94 years.
Something else worth noting about Bespoke's data set is that if the current bull market were extrapolated to present day, more than half (14 out of 27) of all S&P 500 bull markets have lasted longer than the lengthiest bear market (630 calendar days).
The point is that downturns in the U.S. economy and stock market tend to be short-lived and offer investors an opportunity to shine. Investors who lean on time as an ally and maintain perspective have a high probability of success in the stock market, regardless of what short-term correlative events might suggest.
Disclaimer: Investing carries risk. This is not financial advice. The above content should not be regarded as an offer, recommendation, or solicitation on acquiring or disposing of any financial products, any associated discussions, comments, or posts by author or other users should not be considered as such either. It is solely for general information purpose only, which does not consider your own investment objectives, financial situations or needs. TTM assumes no responsibility or warranty for the accuracy and completeness of the information, investors should do their own research and may seek professional advice before investing.
Most Discussed
- 1
- 2
- 3
- 4
- 5
- 6
- 7
- 8
- 9
- 10