Strategy stock price outlook: 52% breakout likely amid rising Bitcoin ETF demand
Strategy stock price could be on the verge of a strong bullish breakout as odds of Bitcoin hitting an all-time high rose on Polymarket.
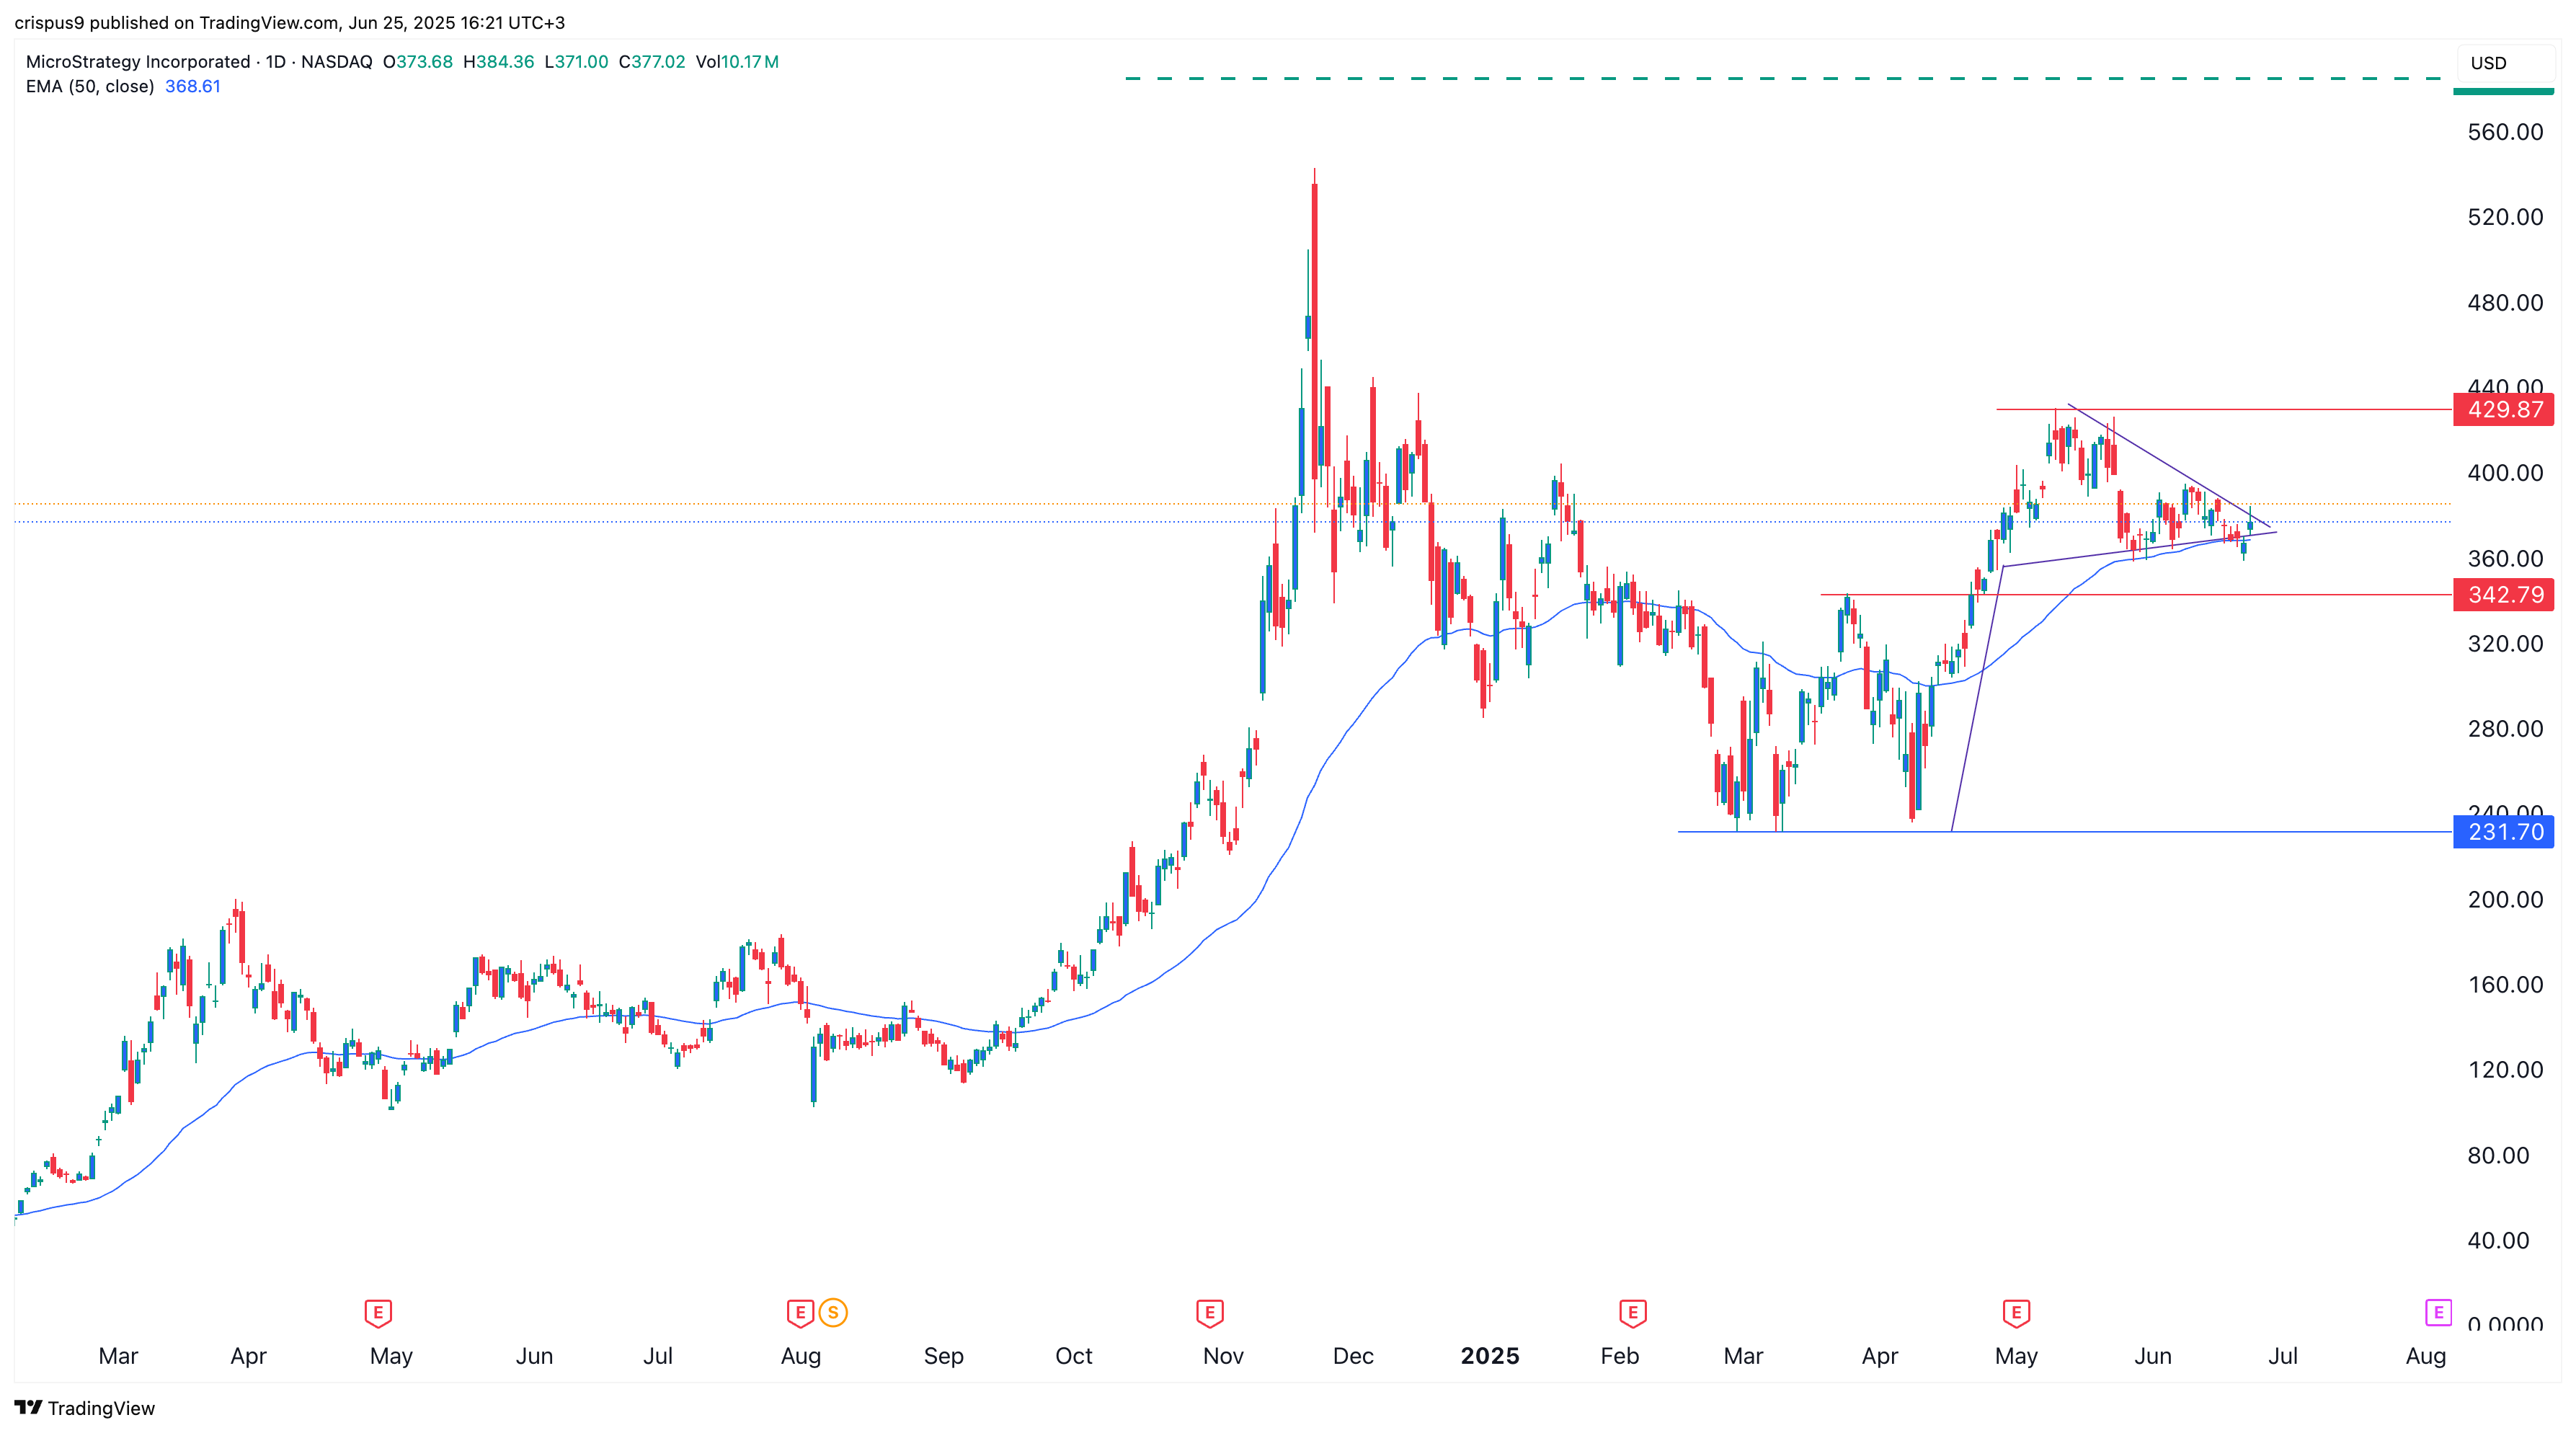
MSTR stock was trading at $377 on Wednesday, a few points above this week’s low of $360. It has jumped nearly 70% from its lowest level this year.
Strategy stock technical analysis points to a surge
The daily chart shows that the MSTR stock price has been in a tight range since May. It has remained above the 100-day and 50-day Exponential Moving Averages, which have provided it with substantial support.
Further, Strategy has formed a bullish pennant pattern, which often leads to additional gains. This pattern is composed of a vertical line and a symmetrical triangle, with a breakout occurring when the two lines near their confluence level.
The profit target in a bullish pennant is established by first measuring the length of the flagpole and then extrapolating the same distance from the breakout point. In this case, the flagpole’s length is $200—$420 minus $230.
The breakout point is $385, bringing the target price to $585, up 52% from the current level. A drop below the support at $342 will invalidate the bullish forecast. This price is the neckline of the double-bottom pattern at $230.

Odds of Bitcoin price hitting all-time high are rising
The main catalyst for the Strategy stock price is the odds of Bitcoin (BTC) hitting a record high before October have jumped to 81% on Polymarket. Such a move would be bullish for Strategy because it holds 592,345 Bitcoins currently valued at over $63 billion.
Bitcoin has strong bullish fundamentals and technicals. For example, Bitcoin supply on exchanges and over-the-counter marketplaces has crashed to the lowest level in years.
Bitcoin ETF demand has jumped, with inflows happening in the last eleven consecutive days. These funds have had a cumulative inflow of $47.9 billion since January last year, with BlackRock’s IBIT having over $72 billion in assets.
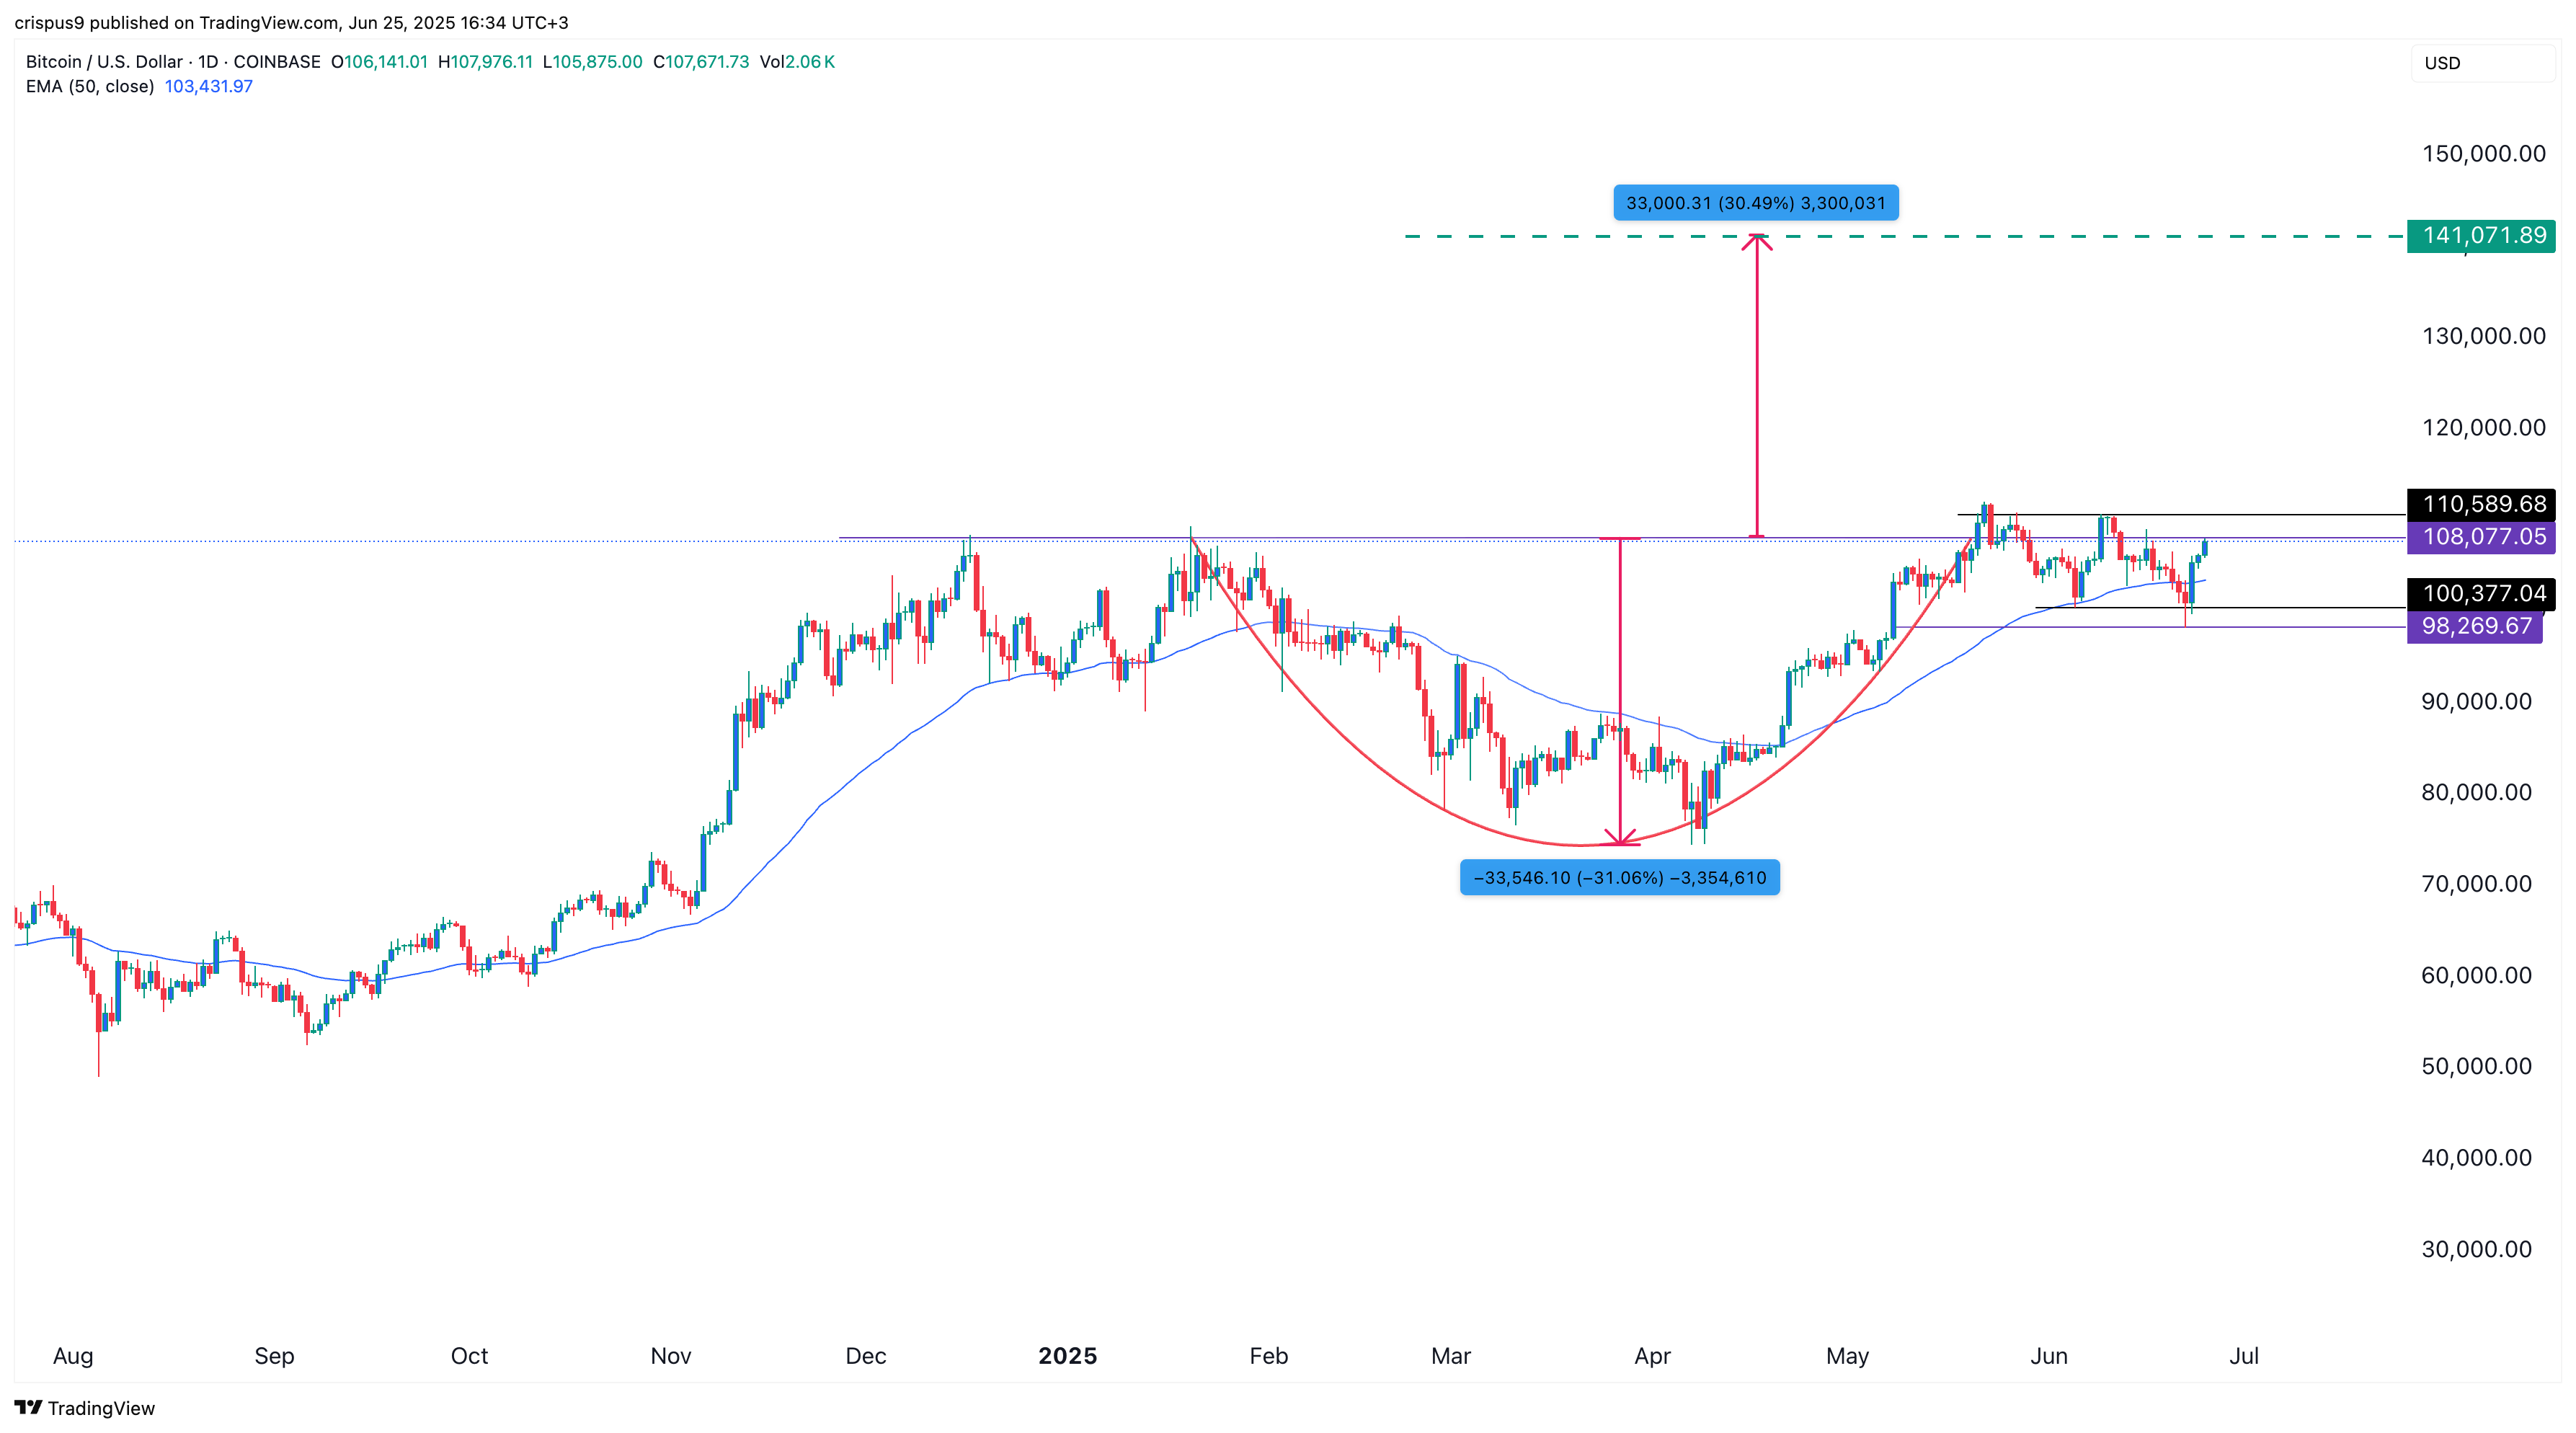
Technically, Bitcoin price has formed a cup-and-handle pattern, a popular continuation setup. This pattern consists of a rounded bottom followed by some consolidation, which is currently underway. Therefore, Bitcoin is likely to break out and potentially rise above $140,000 in the near term.

This price target is based on the cup-and-handle pattern, which has a depth of about 30%. Measuring the same distance from the cup’s upper side yields a target price of $141,000.
Disclaimer: Investing carries risk. This is not financial advice. The above content should not be regarded as an offer, recommendation, or solicitation on acquiring or disposing of any financial products, any associated discussions, comments, or posts by author or other users should not be considered as such either. It is solely for general information purpose only, which does not consider your own investment objectives, financial situations or needs. TTM assumes no responsibility or warranty for the accuracy and completeness of the information, investors should do their own research and may seek professional advice before investing.
Most Discussed
- 1
- 2
- 3
- 4
- 5
- 6
- 7
- 8
- 9
- 10