Magnus Concordia Group Limited (HKG:1172) shares have continued their recent momentum with a 59% gain in the last month alone. Not all shareholders will be feeling jubilant, since the share price is still down a very disappointing 25% in the last twelve months.
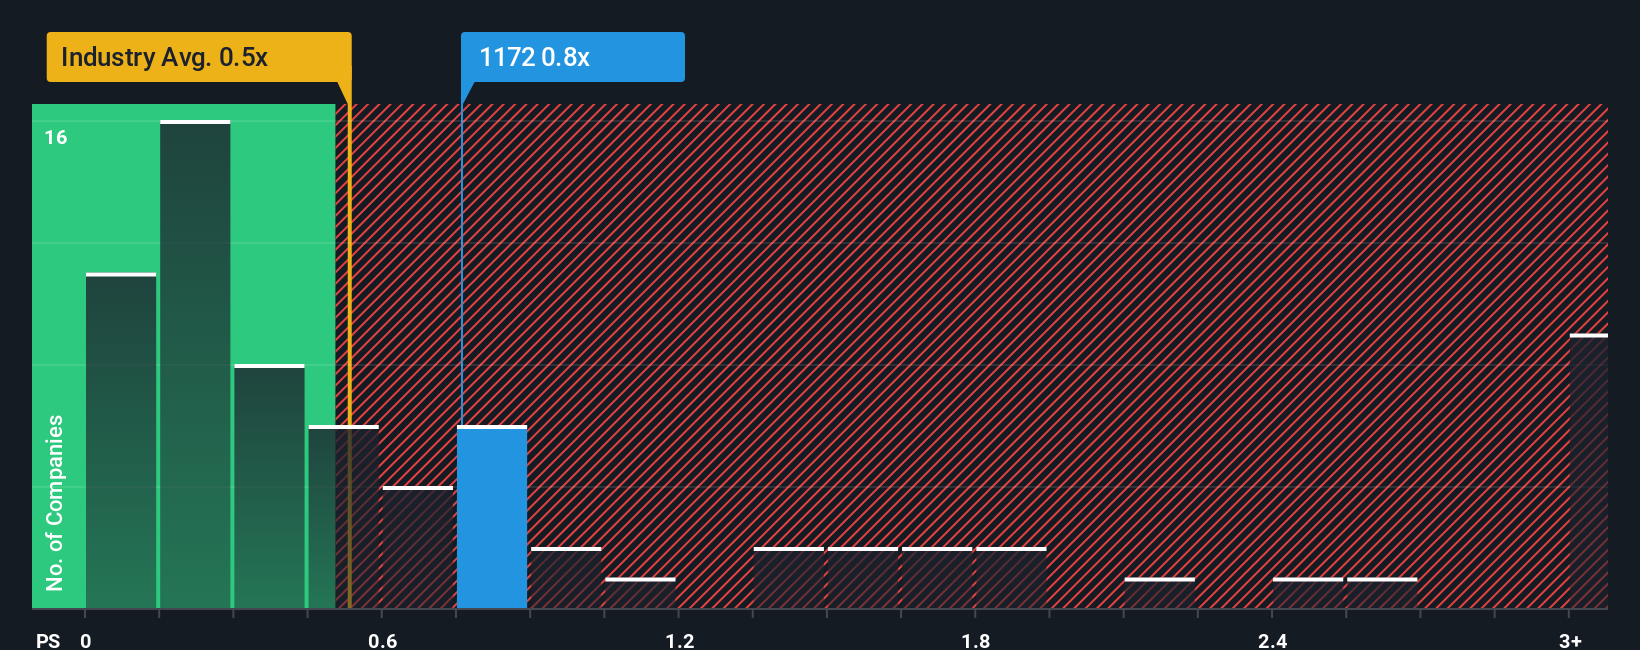
Even after such a large jump in price, there still wouldn't be many who think Magnus Concordia Group's price-to-sales (or "P/S") ratio of 0.8x is worth a mention when the median P/S in Hong Kong's Commercial Services industry is similar at about 0.5x. While this might not raise any eyebrows, if the P/S ratio is not justified investors could be missing out on a potential opportunity or ignoring looming disappointment.
Trump has pledged to "unleash" American oil and gas and these 15 US stocks have developments that are poised to benefit.
Check out our latest analysis for Magnus Concordia Group
How Has Magnus Concordia Group Performed Recently?
For instance, Magnus Concordia Group's receding revenue in recent times would have to be some food for thought. It might be that many expect the company to put the disappointing revenue performance behind them over the coming period, which has kept the P/S from falling. If not, then existing shareholders may be a little nervous about the viability of the share price.
Want the full picture on earnings, revenue and cash flow for the company? Then our free report on Magnus Concordia Group will help you shine a light on its historical performance.What Are Revenue Growth Metrics Telling Us About The P/S?
There's an inherent assumption that a company should be matching the industry for P/S ratios like Magnus Concordia Group's to be considered reasonable.
Taking a look back first, the company's revenue growth last year wasn't something to get excited about as it posted a disappointing decline of 24%. This means it has also seen a slide in revenue over the longer-term as revenue is down 87% in total over the last three years. So unfortunately, we have to acknowledge that the company has not done a great job of growing revenue over that time.
Weighing that medium-term revenue trajectory against the broader industry's one-year forecast for expansion of 5.2% shows it's an unpleasant look.
With this in mind, we find it worrying that Magnus Concordia Group's P/S exceeds that of its industry peers. Apparently many investors in the company are way less bearish than recent times would indicate and aren't willing to let go of their stock right now. Only the boldest would assume these prices are sustainable as a continuation of recent revenue trends is likely to weigh on the share price eventually.
What Does Magnus Concordia Group's P/S Mean For Investors?
Its shares have lifted substantially and now Magnus Concordia Group's P/S is back within range of the industry median. While the price-to-sales ratio shouldn't be the defining factor in whether you buy a stock or not, it's quite a capable barometer of revenue expectations.
The fact that Magnus Concordia Group currently trades at a P/S on par with the rest of the industry is surprising to us since its recent revenues have been in decline over the medium-term, all while the industry is set to grow. Even though it matches the industry, we're uncomfortable with the current P/S ratio, as this dismal revenue performance is unlikely to support a more positive sentiment for long. Unless the the circumstances surrounding the recent medium-term improve, it wouldn't be wrong to expect a a difficult period ahead for the company's shareholders.
Before you settle on your opinion, we've discovered 3 warning signs for Magnus Concordia Group (2 shouldn't be ignored!) that you should be aware of.
If you're unsure about the strength of Magnus Concordia Group's business, why not explore our interactive list of stocks with solid business fundamentals for some other companies you may have missed.
New: Manage All Your Stock Portfolios in One Place
We've created the ultimate portfolio companion for stock investors, and it's free.
• Connect an unlimited number of Portfolios and see your total in one currency• Be alerted to new Warning Signs or Risks via email or mobile• Track the Fair Value of your stocks
Try a Demo Portfolio for FreeHave feedback on this article? Concerned about the content? Get in touch with us directly. Alternatively, email editorial-team (at) simplywallst.com.This article by Simply Wall St is general in nature. We provide commentary based on historical data and analyst forecasts only using an unbiased methodology and our articles are not intended to be financial advice. It does not constitute a recommendation to buy or sell any stock, and does not take account of your objectives, or your financial situation. We aim to bring you long-term focused analysis driven by fundamental data. Note that our analysis may not factor in the latest price-sensitive company announcements or qualitative material. Simply Wall St has no position in any stocks mentioned.