Pilbara Minerals Limited (ASX:PLS) Shares Fly 34% But Investors Aren't Buying For Growth
Pilbara Minerals Limited (ASX:PLS) shareholders would be excited to see that the share price has had a great month, posting a 34% gain and recovering from prior weakness. Still, the 30-day jump doesn't change the fact that longer term shareholders have seen their stock decimated by the 50% share price drop in the last twelve months.
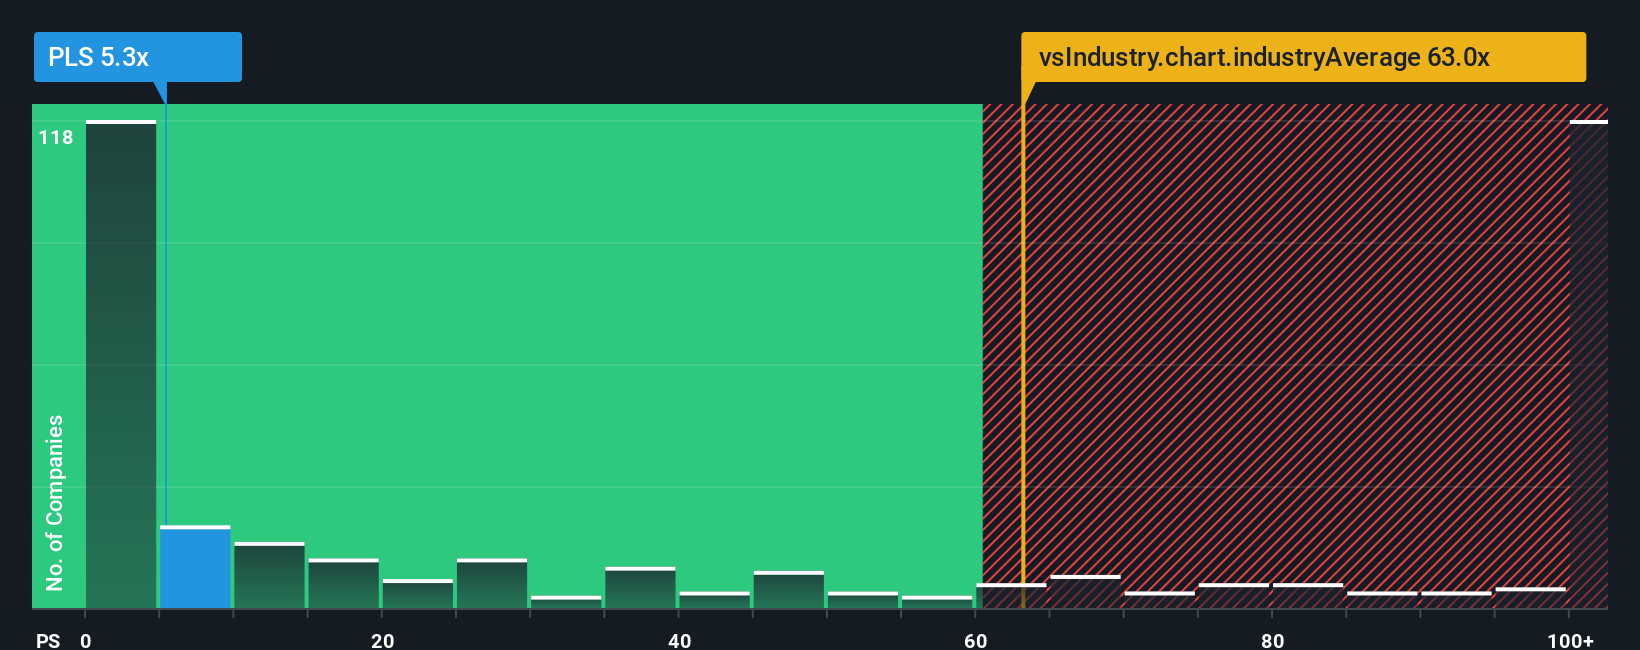
In spite of the firm bounce in price, Pilbara Minerals may still be sending very bullish signals at the moment with its price-to-sales (or "P/S") ratio of 5.3x, since almost half of all companies in the Metals and Mining industry in Australia have P/S ratios greater than 63x and even P/S higher than 415x are not unusual. Although, it's not wise to just take the P/S at face value as there may be an explanation why it's so limited.
Trump has pledged to "unleash" American oil and gas and these 15 US stocks have developments that are poised to benefit.
See our latest analysis for Pilbara Minerals
How Has Pilbara Minerals Performed Recently?
While the industry has experienced revenue growth lately, Pilbara Minerals' revenue has gone into reverse gear, which is not great. It seems that many are expecting the poor revenue performance to persist, which has repressed the P/S ratio. If you still like the company, you'd be hoping this isn't the case so that you could potentially pick up some stock while it's out of favour.
If you'd like to see what analysts are forecasting going forward, you should check out our free report on Pilbara Minerals.Do Revenue Forecasts Match The Low P/S Ratio?
There's an inherent assumption that a company should far underperform the industry for P/S ratios like Pilbara Minerals' to be considered reasonable.
Retrospectively, the last year delivered a frustrating 65% decrease to the company's top line. Even so, admirably revenue has lifted 126% in aggregate from three years ago, notwithstanding the last 12 months. Accordingly, while they would have preferred to keep the run going, shareholders would definitely welcome the medium-term rates of revenue growth.
Turning to the outlook, the next three years should generate growth of 19% per annum as estimated by the analysts watching the company. Meanwhile, the rest of the industry is forecast to expand by 113% per year, which is noticeably more attractive.
In light of this, it's understandable that Pilbara Minerals' P/S sits below the majority of other companies. Apparently many shareholders weren't comfortable holding on while the company is potentially eyeing a less prosperous future.
What We Can Learn From Pilbara Minerals' P/S?
Shares in Pilbara Minerals have risen appreciably however, its P/S is still subdued. We'd say the price-to-sales ratio's power isn't primarily as a valuation instrument but rather to gauge current investor sentiment and future expectations.
As expected, our analysis of Pilbara Minerals' analyst forecasts confirms that the company's underwhelming revenue outlook is a major contributor to its low P/S. Right now shareholders are accepting the low P/S as they concede future revenue probably won't provide any pleasant surprises. Unless these conditions improve, they will continue to form a barrier for the share price around these levels.
The company's balance sheet is another key area for risk analysis. Take a look at our free balance sheet analysis for Pilbara Minerals with six simple checks on some of these key factors.
If strong companies turning a profit tickle your fancy, then you'll want to check out this free list of interesting companies that trade on a low P/E (but have proven they can grow earnings).
New: Manage All Your Stock Portfolios in One Place
We've created the ultimate portfolio companion for stock investors, and it's free.
• Connect an unlimited number of Portfolios and see your total in one currency• Be alerted to new Warning Signs or Risks via email or mobile• Track the Fair Value of your stocks
Try a Demo Portfolio for FreeHave feedback on this article? Concerned about the content? Get in touch with us directly. Alternatively, email editorial-team (at) simplywallst.com.This article by Simply Wall St is general in nature. We provide commentary based on historical data and analyst forecasts only using an unbiased methodology and our articles are not intended to be financial advice. It does not constitute a recommendation to buy or sell any stock, and does not take account of your objectives, or your financial situation. We aim to bring you long-term focused analysis driven by fundamental data. Note that our analysis may not factor in the latest price-sensitive company announcements or qualitative material. Simply Wall St has no position in any stocks mentioned.
Disclaimer: Investing carries risk. This is not financial advice. The above content should not be regarded as an offer, recommendation, or solicitation on acquiring or disposing of any financial products, any associated discussions, comments, or posts by author or other users should not be considered as such either. It is solely for general information purpose only, which does not consider your own investment objectives, financial situations or needs. TTM assumes no responsibility or warranty for the accuracy and completeness of the information, investors should do their own research and may seek professional advice before investing.
Most Discussed
- 1
- 2
- 3
- 4
- 5
- 6
- 7
- 8
- 9
- 10