Further Upside For Tianjin Tianbao Energy Co., Ltd. (HKG:1671) Shares Could Introduce Price Risks After 31% Bounce
Despite an already strong run, Tianjin Tianbao Energy Co., Ltd. (HKG:1671) shares have been powering on, with a gain of 31% in the last thirty days. The annual gain comes to 110% following the latest surge, making investors sit up and take notice.
Although its price has surged higher, Tianjin Tianbao Energy may still be sending very bullish signals at the moment with its price-to-sales (or "P/S") ratio of 0.1x, since almost half of all companies in the Electric Utilities industry in Hong Kong have P/S ratios greater than 3x and even P/S higher than 19x are not unusual. Nonetheless, we'd need to dig a little deeper to determine if there is a rational basis for the highly reduced P/S.
We've found 21 US stocks that are forecast to pay a dividend yield of over 6% next year. See the full list for free.
View our latest analysis for Tianjin Tianbao Energy
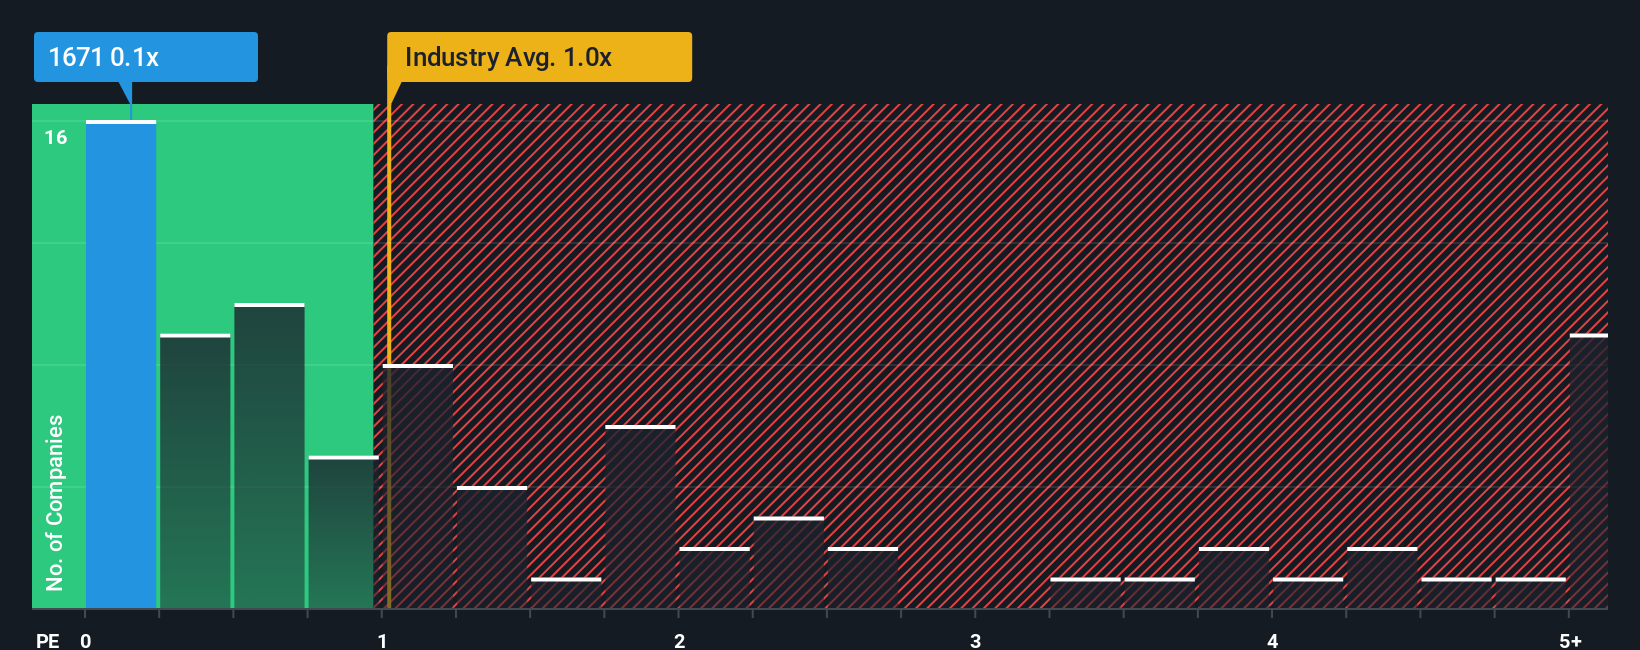
What Does Tianjin Tianbao Energy's P/S Mean For Shareholders?
Revenue has risen at a steady rate over the last year for Tianjin Tianbao Energy, which is generally not a bad outcome. Perhaps the market believes the recent revenue performance might fall short of industry figures in the near future, leading to a reduced P/S. If that doesn't eventuate, then existing shareholders may have reason to be optimistic about the future direction of the share price.
We don't have analyst forecasts, but you can see how recent trends are setting up the company for the future by checking out our free report on Tianjin Tianbao Energy's earnings, revenue and cash flow.Do Revenue Forecasts Match The Low P/S Ratio?
The only time you'd be truly comfortable seeing a P/S as depressed as Tianjin Tianbao Energy's is when the company's growth is on track to lag the industry decidedly.
If we review the last year of revenue growth, the company posted a worthy increase of 5.0%. The latest three year period has also seen an excellent 33% overall rise in revenue, aided somewhat by its short-term performance. Accordingly, shareholders would have definitely welcomed those medium-term rates of revenue growth.
This is in contrast to the rest of the industry, which is expected to grow by 3.9% over the next year, materially lower than the company's recent medium-term annualised growth rates.
With this information, we find it odd that Tianjin Tianbao Energy is trading at a P/S lower than the industry. Apparently some shareholders believe the recent performance has exceeded its limits and have been accepting significantly lower selling prices.
The Bottom Line On Tianjin Tianbao Energy's P/S
Tianjin Tianbao Energy's recent share price jump still sees fails to bring its P/S alongside the industry median. It's argued the price-to-sales ratio is an inferior measure of value within certain industries, but it can be a powerful business sentiment indicator.
We're very surprised to see Tianjin Tianbao Energy currently trading on a much lower than expected P/S since its recent three-year growth is higher than the wider industry forecast. When we see strong revenue with faster-than-industry growth, we assume there are some significant underlying risks to the company's ability to make money which is applying downwards pressure on the P/S ratio. While recent revenue trends over the past medium-term suggest that the risk of a price decline is low, investors appear to perceive a likelihood of revenue fluctuations in the future.
We don't want to rain on the parade too much, but we did also find 4 warning signs for Tianjin Tianbao Energy (2 are a bit concerning!) that you need to be mindful of.
If these risks are making you reconsider your opinion on Tianjin Tianbao Energy, explore our interactive list of high quality stocks to get an idea of what else is out there.
Valuation is complex, but we're here to simplify it.
Discover if Tianjin Tianbao Energy might be undervalued or overvalued with our detailed analysis, featuring fair value estimates, potential risks, dividends, insider trades, and its financial condition.
Access Free AnalysisHave feedback on this article? Concerned about the content? Get in touch with us directly. Alternatively, email editorial-team (at) simplywallst.com.This article by Simply Wall St is general in nature. We provide commentary based on historical data and analyst forecasts only using an unbiased methodology and our articles are not intended to be financial advice. It does not constitute a recommendation to buy or sell any stock, and does not take account of your objectives, or your financial situation. We aim to bring you long-term focused analysis driven by fundamental data. Note that our analysis may not factor in the latest price-sensitive company announcements or qualitative material. Simply Wall St has no position in any stocks mentioned.
Disclaimer: Investing carries risk. This is not financial advice. The above content should not be regarded as an offer, recommendation, or solicitation on acquiring or disposing of any financial products, any associated discussions, comments, or posts by author or other users should not be considered as such either. It is solely for general information purpose only, which does not consider your own investment objectives, financial situations or needs. TTM assumes no responsibility or warranty for the accuracy and completeness of the information, investors should do their own research and may seek professional advice before investing.
Most Discussed
- 1
- 2
- 3
- 4
- 5
- 6
- 7
- 8
- 9
- 10