Anton Oilfield Services Group Leads These 3 Asian Penny Stocks
Amidst a backdrop of easing global trade tensions and positive economic indicators, Asian markets have shown resilience and growth. This environment highlights the potential for penny stocks, which, despite their vintage label, remain relevant by offering opportunities in smaller or emerging companies. By focusing on those with robust financials and clear growth prospects, investors can explore these stocks as viable options for capturing value in an evolving market landscape.
Top 10 Penny Stocks In Asia
| Name | Share Price | Market Cap | Rewards & Risks |
| Lever Style (SEHK:1346) | HK$1.24 | HK$782.38M | ✅ 4 ⚠️ 2 View Analysis > |
| Ever Sunshine Services Group (SEHK:1995) | HK$2.08 | HK$3.6B | ✅ 5 ⚠️ 2 View Analysis > |
| TK Group (Holdings) (SEHK:2283) | HK$2.27 | HK$1.89B | ✅ 3 ⚠️ 1 View Analysis > |
| CNMC Goldmine Holdings (Catalist:5TP) | SGD0.43 | SGD174.27M | ✅ 4 ⚠️ 2 View Analysis > |
| Goodbaby International Holdings (SEHK:1086) | HK$1.13 | HK$1.89B | ✅ 4 ⚠️ 2 View Analysis > |
| Yangzijiang Shipbuilding (Holdings) (SGX:BS6) | SGD2.24 | SGD8.82B | ✅ 5 ⚠️ 0 View Analysis > |
| Beng Kuang Marine (SGX:BEZ) | SGD0.205 | SGD41.45M | ✅ 4 ⚠️ 3 View Analysis > |
| BRC Asia (SGX:BEC) | SGD3.10 | SGD850.49M | ✅ 4 ⚠️ 1 View Analysis > |
| Bosideng International Holdings (SEHK:3998) | HK$4.54 | HK$52.01B | ✅ 4 ⚠️ 1 View Analysis > |
| United Energy Group (SEHK:467) | HK$0.54 | HK$13.96B | ✅ 4 ⚠️ 4 View Analysis > |
Click here to see the full list of 997 stocks from our Asian Penny Stocks screener.
Let's explore several standout options from the results in the screener.
Anton Oilfield Services Group (SEHK:3337)
Simply Wall St Financial Health Rating: ★★★★★★
Overview: Anton Oilfield Services Group is an investment holding company that provides integrated oilfield technology services in the People's Republic of China, Iraq, and internationally, with a market cap of HK$4.11 billion.
Operations: The company's revenue is primarily derived from Oilfield Technical Services (CN¥2.13 billion) and Oilfield Management Services (CN¥1.85 billion), with additional contributions from Inspection Services (CN¥421.04 million) and Drilling Rig Services (CN¥358.89 million).
Market Cap: HK$4.11B
Anton Oilfield Services Group has recently secured a significant contract for oil and gas facilities in Malaysia, highlighting its strategic expansion efforts. The company demonstrates financial stability with cash exceeding total debt and strong coverage of interest payments by EBIT. Its earnings growth outpaces the industry, supported by high-quality past earnings and improved profit margins. Despite low return on equity, Anton's short-term assets comfortably cover liabilities, indicating solid liquidity management. The board's experience further strengthens governance. However, while trading at a substantial discount to estimated fair value, investors should weigh these factors against market volatility considerations.
- Click here and access our complete financial health analysis report to understand the dynamics of Anton Oilfield Services Group.
- Evaluate Anton Oilfield Services Group's prospects by accessing our earnings growth report.

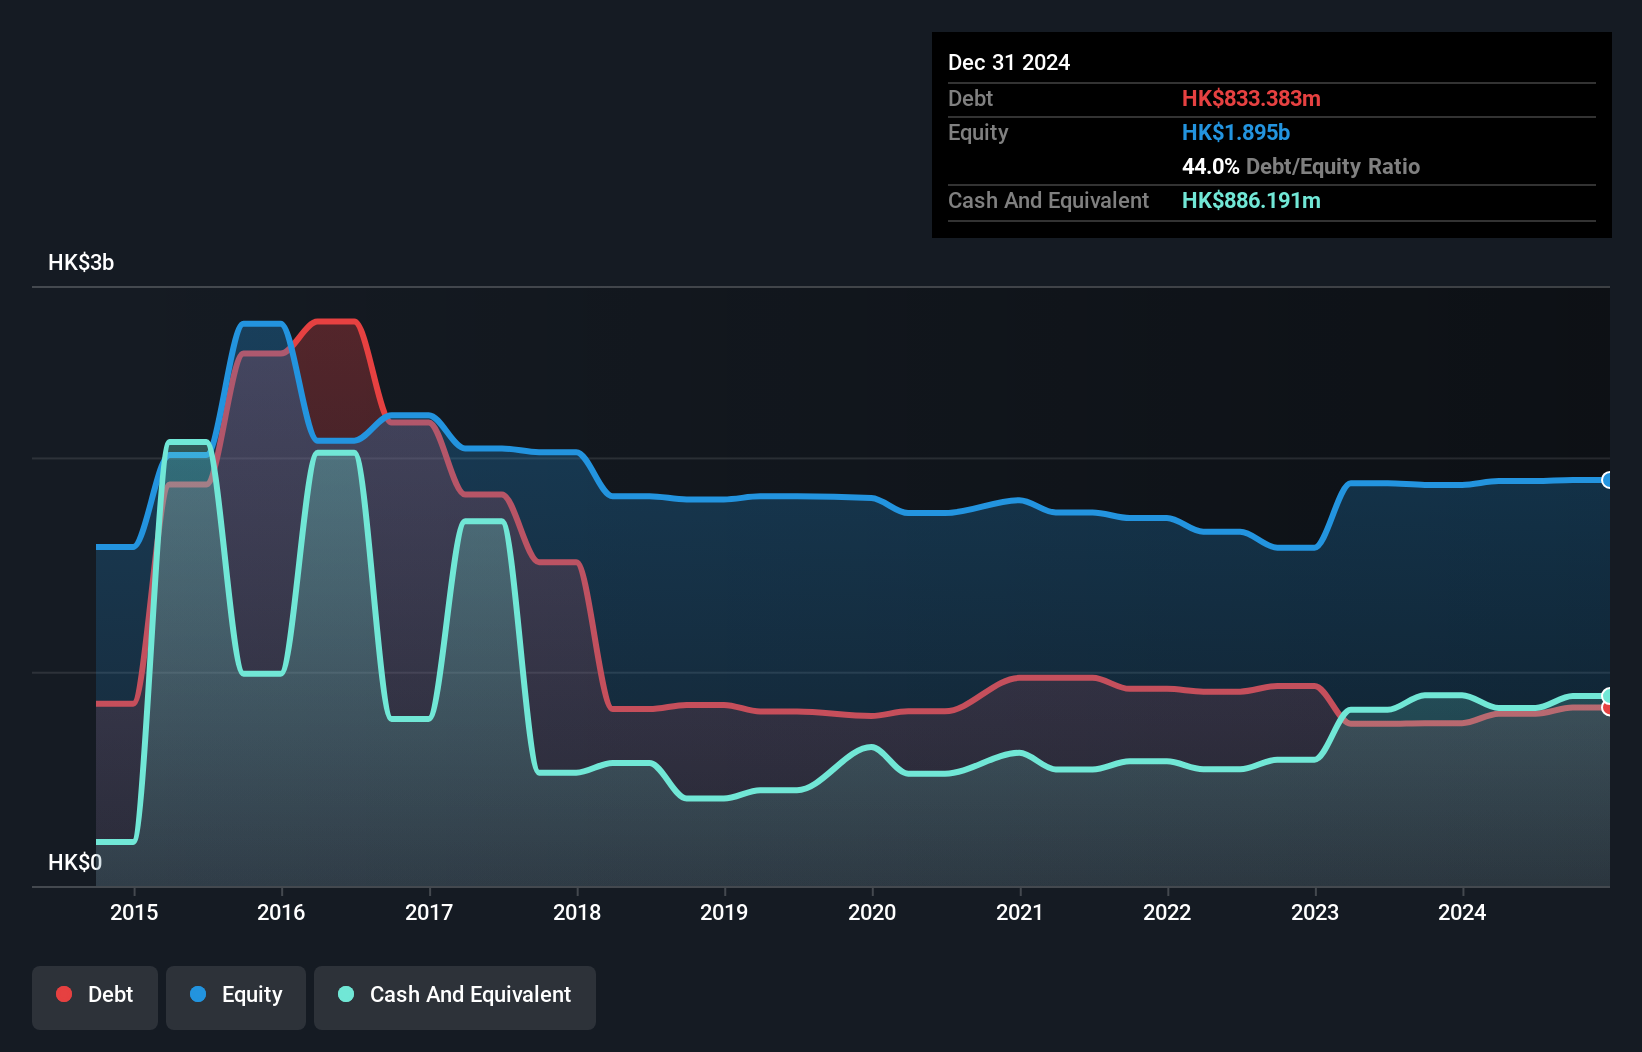
Tian An Medicare (SEHK:383)
Simply Wall St Financial Health Rating: ★★★★☆☆
Overview: Tian An Medicare Limited is an investment holding company that primarily operates hospitals in the People’s Republic of China and Hong Kong, with a market cap of HK$1.23 billion.
Operations: The company's revenue is primarily derived from its Healthcare segment, which accounts for HK$1.58 billion, followed by Eldercare at HK$41.83 million and Property Investment at HK$4.34 million.
Market Cap: HK$1.23B
Tian An Medicare Limited, with a market cap of HK$1.23 billion, has shown robust earnings growth of 96% over the past year, surpassing industry averages. The company's financial health is supported by more cash than total debt and interest coverage that isn't a concern. Short-term assets exceed both short and long-term liabilities, indicating solid liquidity management. Recent share repurchase initiatives are set to enhance net asset value per share and earnings per share. However, the board's inexperience and high stock volatility remain considerations for investors evaluating this healthcare-focused investment holding company in Asia.
- Take a closer look at Tian An Medicare's potential here in our financial health report.
- Review our historical performance report to gain insights into Tian An Medicare's track record.
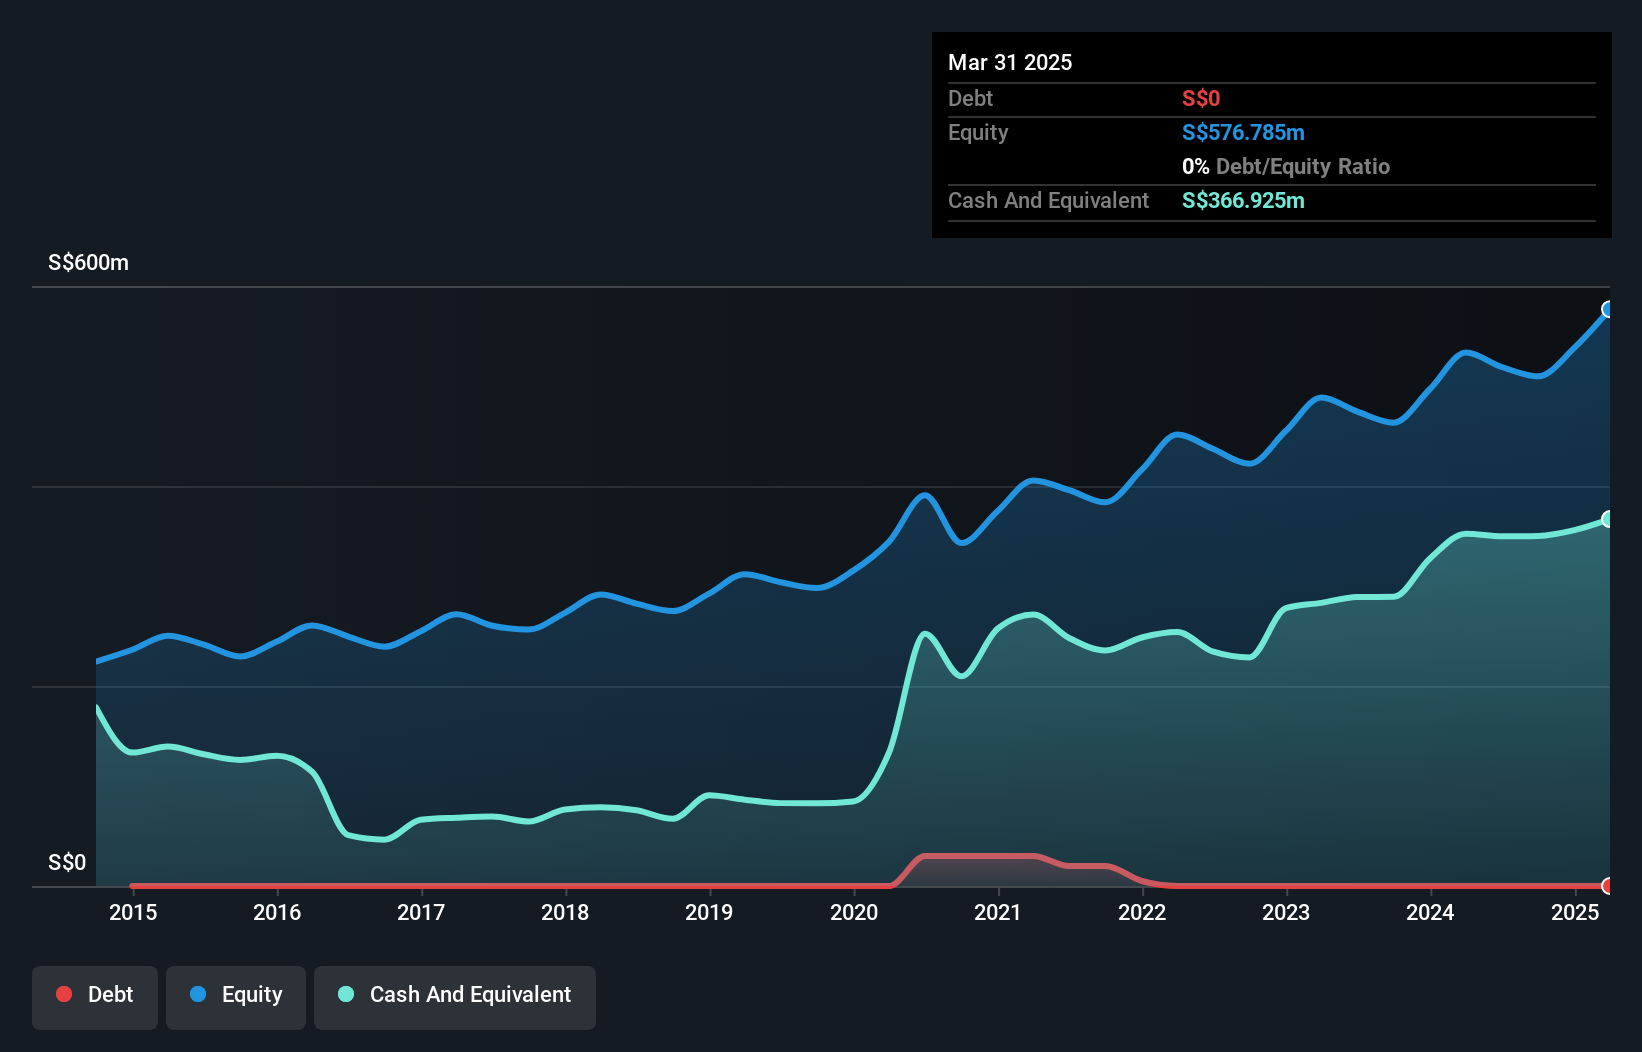
Sheng Siong Group (SGX:OV8)
Simply Wall St Financial Health Rating: ★★★★★★
Overview: Sheng Siong Group Ltd is an investment holding company that operates a chain of supermarket retail stores in Singapore, with a market cap of SGD2.90 billion.
Operations: The company generates revenue from its supermarket operations selling consumer goods, amounting to SGD1.46 billion.
Market Cap: SGD2.9B
Sheng Siong Group Ltd, with a market cap of SGD2.90 billion, continues to expand its retail footprint by securing six new locations set to open by the third quarter of 2025. The company maintains a strong financial position with no debt and short-term assets exceeding liabilities, ensuring liquidity stability. Despite stable weekly volatility and high-quality earnings, recent earnings growth has been modest at 2.2%, below its five-year average of 3.5%. The board's experience supports strategic decisions like dividend affirmations and network expansion, aligning with long-term growth strategies in Singapore's competitive retail sector.
- Navigate through the intricacies of Sheng Siong Group with our comprehensive balance sheet health report here.
- Explore Sheng Siong Group's analyst forecasts in our growth report.
Where To Now?
- Discover the full array of 997 Asian Penny Stocks right here.
- Searching for a Fresh Perspective? Find companies with promising cash flow potential yet trading below their fair value.
This article by Simply Wall St is general in nature. We provide commentary based on historical data and analyst forecasts only using an unbiased methodology and our articles are not intended to be financial advice. It does not constitute a recommendation to buy or sell any stock, and does not take account of your objectives, or your financial situation. We aim to bring you long-term focused analysis driven by fundamental data. Note that our analysis may not factor in the latest price-sensitive company announcements or qualitative material. Simply Wall St has no position in any stocks mentioned.
New: Manage All Your Stock Portfolios in One Place
We've created the ultimate portfolio companion for stock investors, and it's free.
• Connect an unlimited number of Portfolios and see your total in one currency• Be alerted to new Warning Signs or Risks via email or mobile• Track the Fair Value of your stocks
Try a Demo Portfolio for FreeHave feedback on this article? Concerned about the content? Get in touch with us directly. Alternatively, email editorial-team@simplywallst.com
Disclaimer: Investing carries risk. This is not financial advice. The above content should not be regarded as an offer, recommendation, or solicitation on acquiring or disposing of any financial products, any associated discussions, comments, or posts by author or other users should not be considered as such either. It is solely for general information purpose only, which does not consider your own investment objectives, financial situations or needs. TTM assumes no responsibility or warranty for the accuracy and completeness of the information, investors should do their own research and may seek professional advice before investing.
Most Discussed
- 1
- 2
- 3
- 4
- 5
- 6
- 7
- 8
- 9
- 10