Investor Optimism Abounds Under Armour, Inc. (NYSE:UAA) But Growth Is Lacking
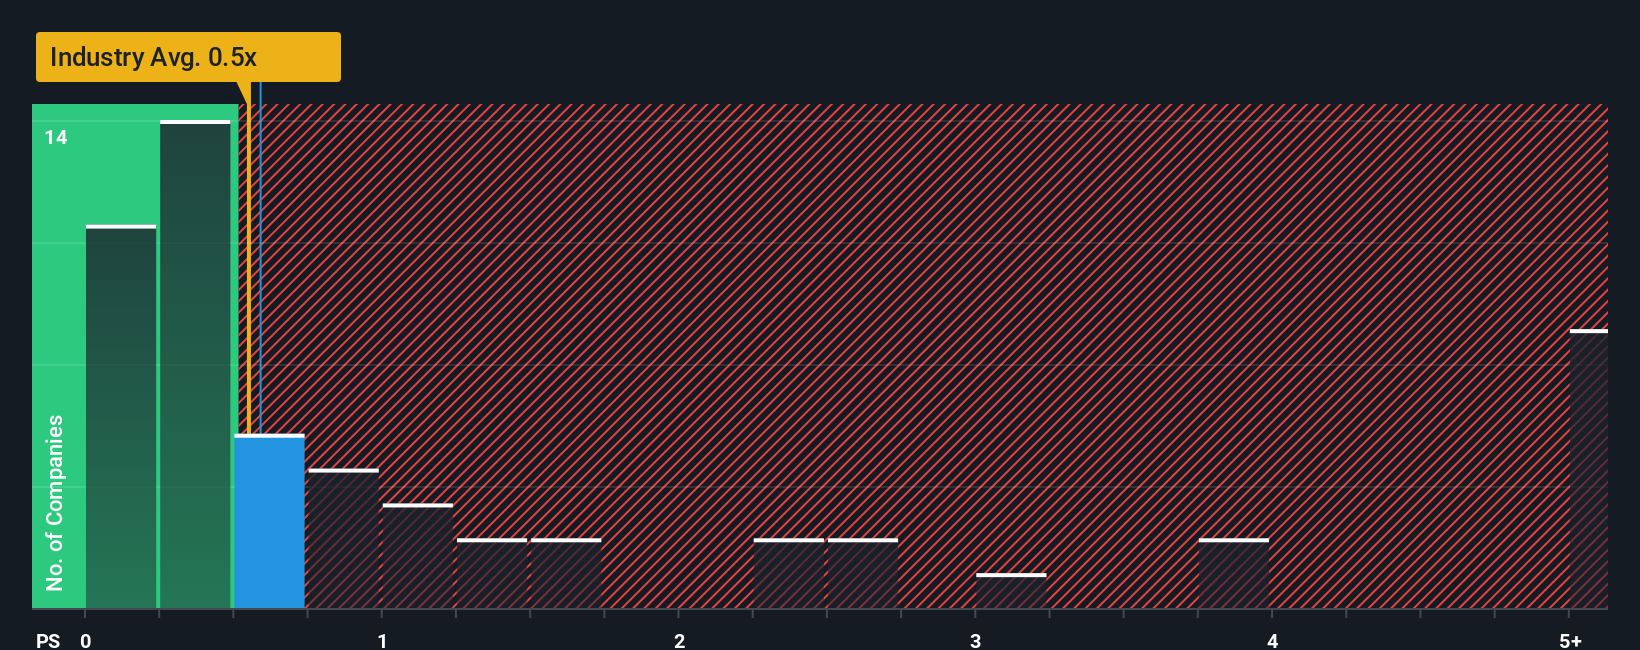
With a median price-to-sales (or "P/S") ratio of close to 0.5x in the Luxury industry in the United States, you could be forgiven for feeling indifferent about Under Armour, Inc.'s (NYSE:UAA) P/S ratio of 0.6x. However, investors might be overlooking a clear opportunity or potential setback if there is no rational basis for the P/S.
This technology could replace computers: discover the 20 stocks are working to make quantum computing a reality.
Check out our latest analysis for Under Armour
How Has Under Armour Performed Recently?
While the industry has experienced revenue growth lately, Under Armour's revenue has gone into reverse gear, which is not great. It might be that many expect the dour revenue performance to strengthen positively, which has kept the P/S from falling. You'd really hope so, otherwise you're paying a relatively elevated price for a company with this sort of growth profile.
Want the full picture on analyst estimates for the company? Then our free report on Under Armour will help you uncover what's on the horizon.How Is Under Armour's Revenue Growth Trending?
The only time you'd be comfortable seeing a P/S like Under Armour's is when the company's growth is tracking the industry closely.
Retrospectively, the last year delivered a frustrating 9.4% decrease to the company's top line. The last three years don't look nice either as the company has shrunk revenue by 9.8% in aggregate. Accordingly, shareholders would have felt downbeat about the medium-term rates of revenue growth.
Shifting to the future, estimates from the analysts covering the company suggest revenue should grow by 1.8% per year over the next three years. With the industry predicted to deliver 6.5% growth per annum, the company is positioned for a weaker revenue result.
With this in mind, we find it intriguing that Under Armour's P/S is closely matching its industry peers. Apparently many investors in the company are less bearish than analysts indicate and aren't willing to let go of their stock right now. These shareholders may be setting themselves up for future disappointment if the P/S falls to levels more in line with the growth outlook.
What We Can Learn From Under Armour's P/S?
While the price-to-sales ratio shouldn't be the defining factor in whether you buy a stock or not, it's quite a capable barometer of revenue expectations.
Our look at the analysts forecasts of Under Armour's revenue prospects has shown that its inferior revenue outlook isn't negatively impacting its P/S as much as we would have predicted. When we see companies with a relatively weaker revenue outlook compared to the industry, we suspect the share price is at risk of declining, sending the moderate P/S lower. Circumstances like this present a risk to current and prospective investors who may see share prices fall if the low revenue growth impacts the sentiment.
The company's balance sheet is another key area for risk analysis. You can assess many of the main risks through our free balance sheet analysis for Under Armour with six simple checks.
It's important to make sure you look for a great company, not just the first idea you come across. So if growing profitability aligns with your idea of a great company, take a peek at this free list of interesting companies with strong recent earnings growth (and a low P/E).
New: AI Stock Screener & Alerts
Our new AI Stock Screener scans the market every day to uncover opportunities.
• Dividend Powerhouses (3%+ Yield)• Undervalued Small Caps with Insider Buying• High growth Tech and AI CompaniesOr build your own from over 50 metrics.
Explore Now for FreeHave feedback on this article? Concerned about the content? Get in touch with us directly. Alternatively, email editorial-team (at) simplywallst.com.This article by Simply Wall St is general in nature. We provide commentary based on historical data and analyst forecasts only using an unbiased methodology and our articles are not intended to be financial advice. It does not constitute a recommendation to buy or sell any stock, and does not take account of your objectives, or your financial situation. We aim to bring you long-term focused analysis driven by fundamental data. Note that our analysis may not factor in the latest price-sensitive company announcements or qualitative material. Simply Wall St has no position in any stocks mentioned.
Disclaimer: Investing carries risk. This is not financial advice. The above content should not be regarded as an offer, recommendation, or solicitation on acquiring or disposing of any financial products, any associated discussions, comments, or posts by author or other users should not be considered as such either. It is solely for general information purpose only, which does not consider your own investment objectives, financial situations or needs. TTM assumes no responsibility or warranty for the accuracy and completeness of the information, investors should do their own research and may seek professional advice before investing.
Most Discussed
- 1
- 2
- 3
- 4
- 5
- 6
- 7
- 8
- 9
- 10