Asia Orient Holdings Full Year 2025 Earnings: HK$2.66 loss per share (vs HK$4.48 loss in FY 2024)
Asia Orient Holdings (HKG:214) Full Year 2025 Results
Key Financial Results
- Revenue: HK$2.51b (up 32% from FY 2024).
- Net loss: HK$2.24b (loss narrowed by 41% from FY 2024).
- HK$2.66 loss per share (improved from HK$4.48 loss in FY 2024).
This technology could replace computers: discover the 20 stocks are working to make quantum computing a reality.
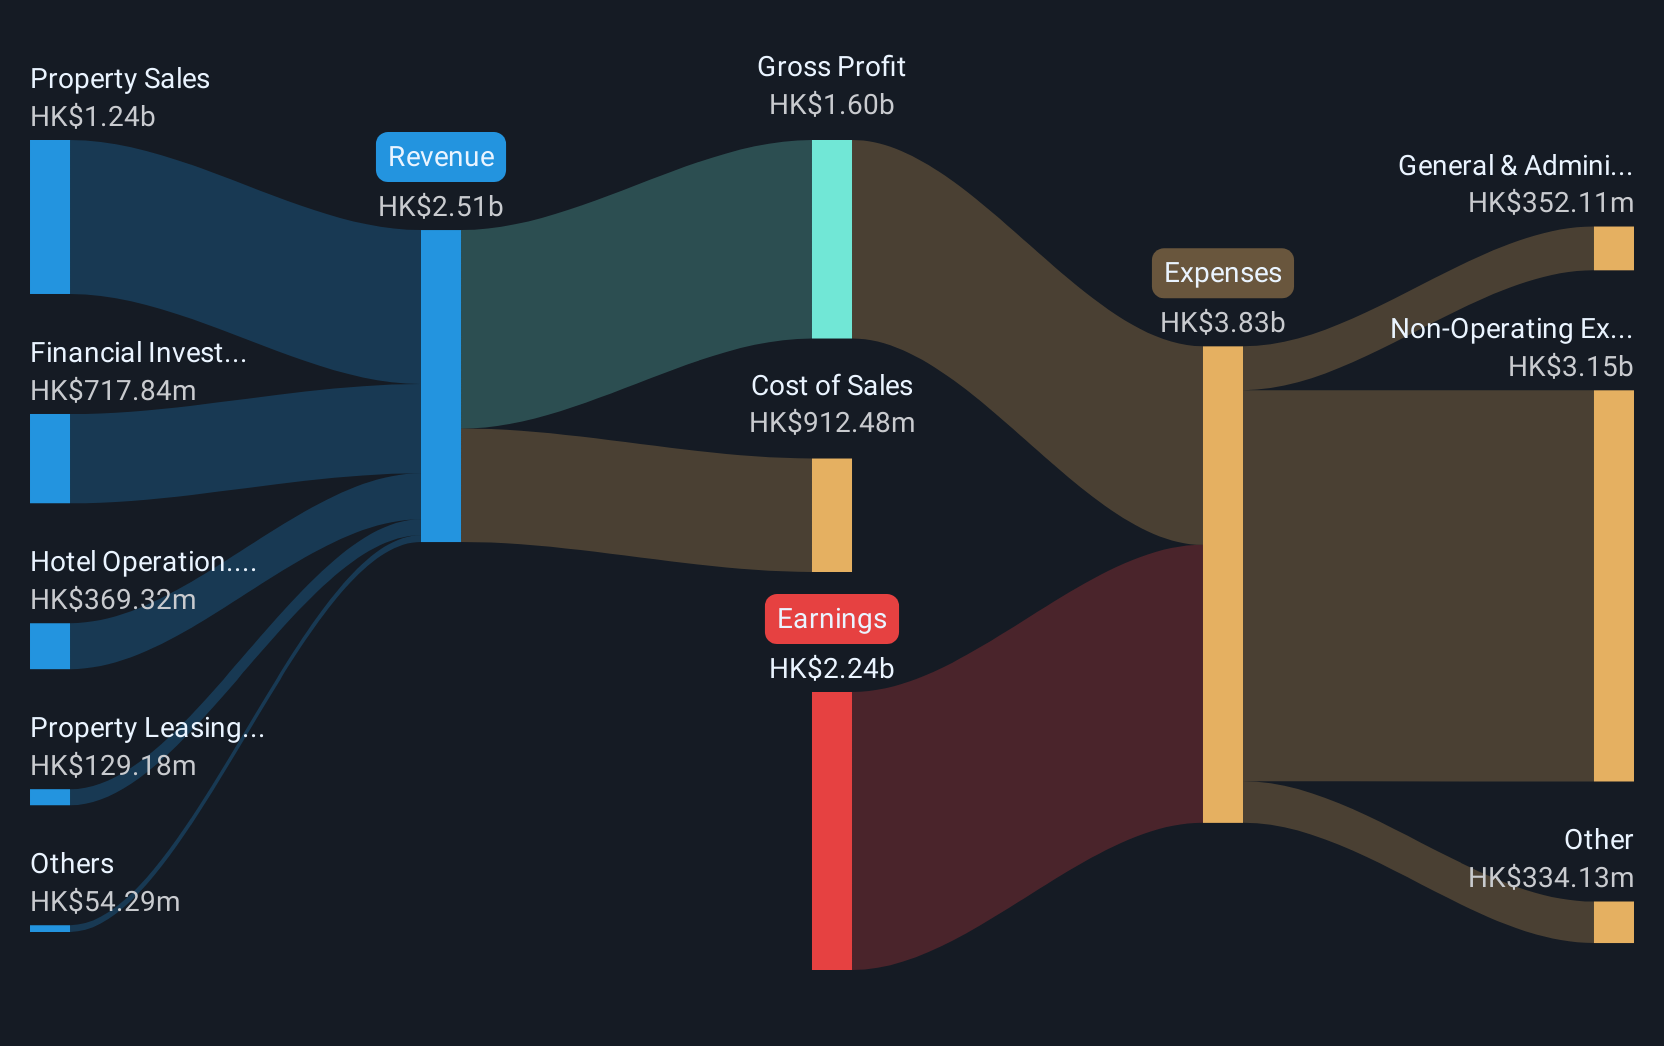
All figures shown in the chart above are for the trailing 12 month (TTM) period
The primary driver behind last 12 months revenue was the Property Sales segment contributing a total revenue of HK$1.24b (49% of total revenue). The most substantial expense, totaling HK$3.15b were related to Non-Operating costs. This indicates that a significant portion of the company's costs is related to non-core activities. Explore how 214's revenue and expenses shape its earnings.
Asia Orient Holdings shares are down 10% from a week ago.
Risk Analysis
It is worth noting though that we have found 3 warning signs for Asia Orient Holdings (2 can't be ignored!) that you need to take into consideration.
New: Manage All Your Stock Portfolios in One Place
We've created the ultimate portfolio companion for stock investors, and it's free.
• Connect an unlimited number of Portfolios and see your total in one currency• Be alerted to new Warning Signs or Risks via email or mobile• Track the Fair Value of your stocks
Try a Demo Portfolio for FreeHave feedback on this article? Concerned about the content? Get in touch with us directly. Alternatively, email editorial-team (at) simplywallst.com.This article by Simply Wall St is general in nature. We provide commentary based on historical data and analyst forecasts only using an unbiased methodology and our articles are not intended to be financial advice. It does not constitute a recommendation to buy or sell any stock, and does not take account of your objectives, or your financial situation. We aim to bring you long-term focused analysis driven by fundamental data. Note that our analysis may not factor in the latest price-sensitive company announcements or qualitative material. Simply Wall St has no position in any stocks mentioned.
Disclaimer: Investing carries risk. This is not financial advice. The above content should not be regarded as an offer, recommendation, or solicitation on acquiring or disposing of any financial products, any associated discussions, comments, or posts by author or other users should not be considered as such either. It is solely for general information purpose only, which does not consider your own investment objectives, financial situations or needs. TTM assumes no responsibility or warranty for the accuracy and completeness of the information, investors should do their own research and may seek professional advice before investing.
Most Discussed
- 1
- 2
- 3
- 4
- 5
- 6
- 7
- 8
- 9
- 10