Ampol Limited's (ASX:ALD) Stock Has Seen Strong Momentum: Does That Call For Deeper Study Of Its Financial Prospects?
Most readers would already be aware that Ampol's (ASX:ALD) stock increased significantly by 14% over the past three months. We wonder if and what role the company's financials play in that price change as a company's long-term fundamentals usually dictate market outcomes. In this article, we decided to focus on Ampol's ROE.
ROE or return on equity is a useful tool to assess how effectively a company can generate returns on the investment it received from its shareholders. Put another way, it reveals the company's success at turning shareholder investments into profits.
AI is about to change healthcare. These 20 stocks are working on everything from early diagnostics to drug discovery. The best part - they are all under $10bn in marketcap - there is still time to get in early.
How To Calculate Return On Equity?
The formula for return on equity is:
Return on Equity = Net Profit (from continuing operations) ÷ Shareholders' Equity
So, based on the above formula, the ROE for Ampol is:
4.9% = AU$176m ÷ AU$3.6b (Based on the trailing twelve months to December 2024).
The 'return' is the yearly profit. So, this means that for every A$1 of its shareholder's investments, the company generates a profit of A$0.05.
See our latest analysis for Ampol
What Has ROE Got To Do With Earnings Growth?
So far, we've learned that ROE is a measure of a company's profitability. We now need to evaluate how much profit the company reinvests or "retains" for future growth which then gives us an idea about the growth potential of the company. Assuming everything else remains unchanged, the higher the ROE and profit retention, the higher the growth rate of a company compared to companies that don't necessarily bear these characteristics.
A Side By Side comparison of Ampol's Earnings Growth And 4.9% ROE
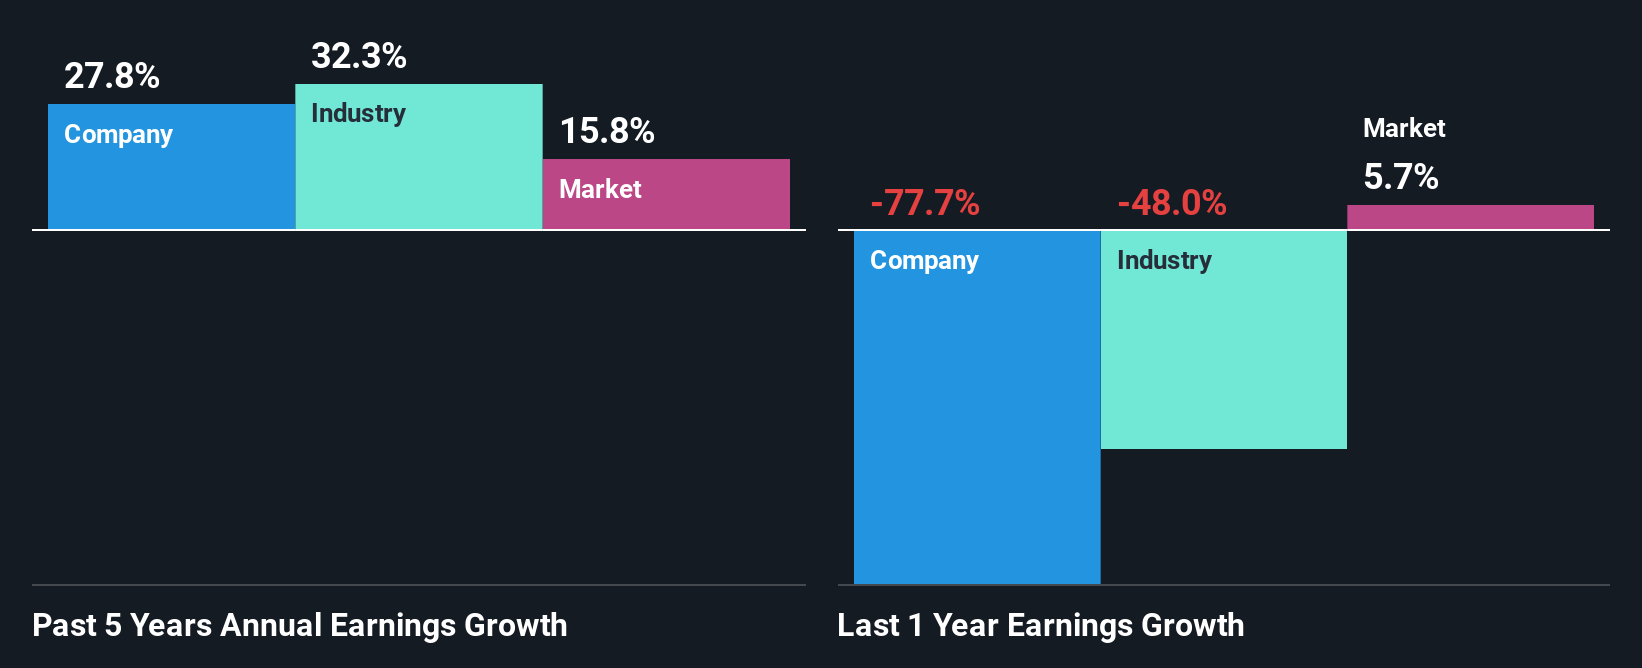
It is hard to argue that Ampol's ROE is much good in and of itself. Not just that, even compared to the industry average of 6.5%, the company's ROE is entirely unremarkable. Despite this, surprisingly, Ampol saw an exceptional 28% net income growth over the past five years. We believe that there might be other aspects that are positively influencing the company's earnings growth. Such as - high earnings retention or an efficient management in place.
As a next step, we compared Ampol's net income growth with the industry and found that the company has a similar growth figure when compared with the industry average growth rate of 32% in the same period.
Earnings growth is an important metric to consider when valuing a stock. The investor should try to establish if the expected growth or decline in earnings, whichever the case may be, is priced in. This then helps them determine if the stock is placed for a bright or bleak future. One good indicator of expected earnings growth is the P/E ratio which determines the price the market is willing to pay for a stock based on its earnings prospects. So, you may want to check if Ampol is trading on a high P/E or a low P/E, relative to its industry.
Is Ampol Efficiently Re-investing Its Profits?
The high three-year median payout ratio of 74% (implying that it keeps only 26% of profits) for Ampol suggests that the company's growth wasn't really hampered despite it returning most of the earnings to its shareholders.
Besides, Ampol has been paying dividends for at least ten years or more. This shows that the company is committed to sharing profits with its shareholders. Our latest analyst data shows that the future payout ratio of the company over the next three years is expected to be approximately 61%. However, Ampol's ROE is predicted to rise to 11% despite there being no anticipated change in its payout ratio.
Conclusion
On the whole, we do feel that Ampol has some positive attributes. While no doubt its earnings growth is pretty substantial, we do feel that the reinvestment rate is pretty low, meaning, the earnings growth number could have been significantly higher had the company been retaining more of its profits. Up till now, we've only made a short study of the company's growth data. So it may be worth checking this free detailed graph of Ampol's past earnings, as well as revenue and cash flows to get a deeper insight into the company's performance.
New: Manage All Your Stock Portfolios in One Place
We've created the ultimate portfolio companion for stock investors, and it's free.
• Connect an unlimited number of Portfolios and see your total in one currency• Be alerted to new Warning Signs or Risks via email or mobile• Track the Fair Value of your stocks
Try a Demo Portfolio for FreeHave feedback on this article? Concerned about the content? Get in touch with us directly. Alternatively, email editorial-team (at) simplywallst.com.This article by Simply Wall St is general in nature. We provide commentary based on historical data and analyst forecasts only using an unbiased methodology and our articles are not intended to be financial advice. It does not constitute a recommendation to buy or sell any stock, and does not take account of your objectives, or your financial situation. We aim to bring you long-term focused analysis driven by fundamental data. Note that our analysis may not factor in the latest price-sensitive company announcements or qualitative material. Simply Wall St has no position in any stocks mentioned.
Disclaimer: Investing carries risk. This is not financial advice. The above content should not be regarded as an offer, recommendation, or solicitation on acquiring or disposing of any financial products, any associated discussions, comments, or posts by author or other users should not be considered as such either. It is solely for general information purpose only, which does not consider your own investment objectives, financial situations or needs. TTM assumes no responsibility or warranty for the accuracy and completeness of the information, investors should do their own research and may seek professional advice before investing.
Most Discussed
- 1
- 2
- 3
- 4
- 5
- 6
- 7
- 8
- 9
- 10