LiveRamp Holdings, Inc.'s (NYSE:RAMP) Share Price Is Matching Sentiment Around Its Revenues
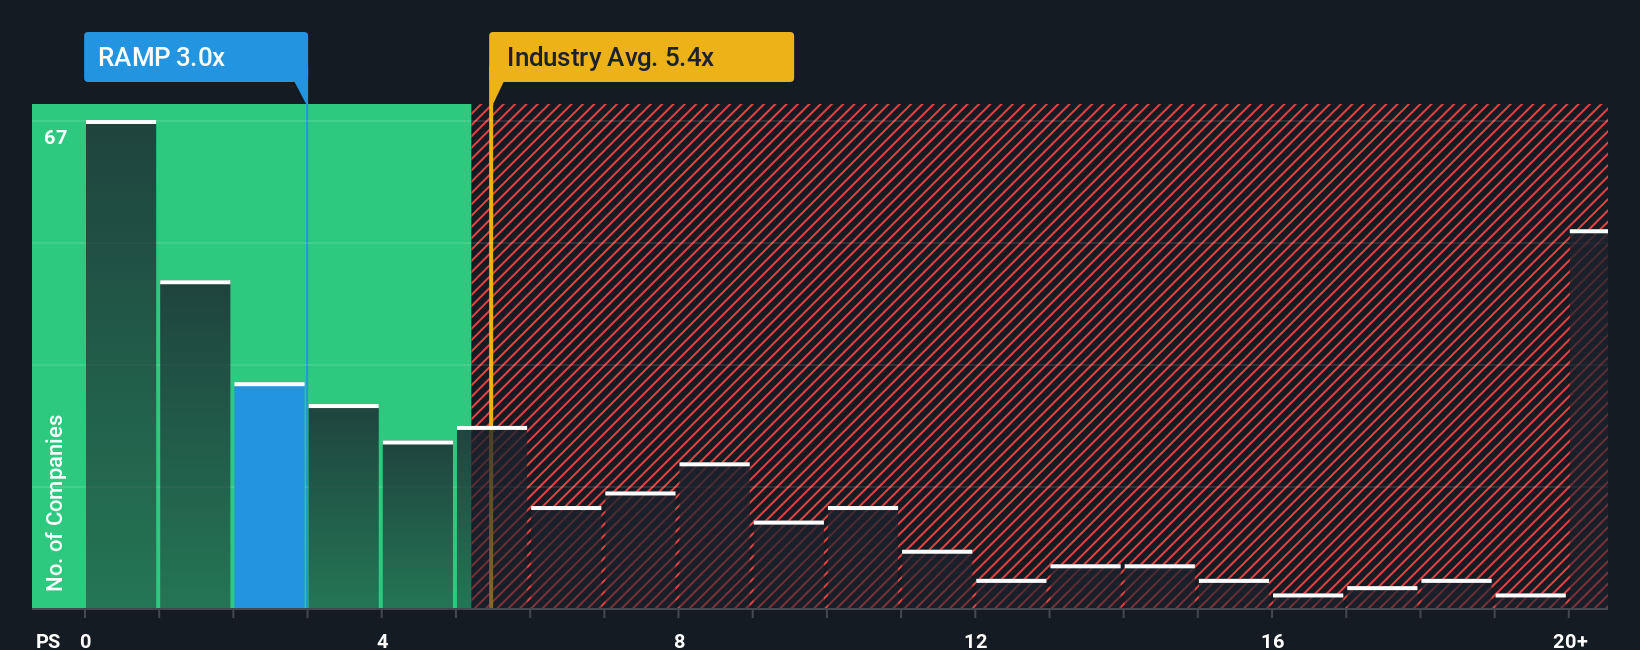
With a price-to-sales (or "P/S") ratio of 3x LiveRamp Holdings, Inc. (NYSE:RAMP) may be sending bullish signals at the moment, given that almost half of all the Software companies in the United States have P/S ratios greater than 5.4x and even P/S higher than 12x are not unusual. However, the P/S might be low for a reason and it requires further investigation to determine if it's justified.
AI is about to change healthcare. These 20 stocks are working on everything from early diagnostics to drug discovery. The best part - they are all under $10bn in marketcap - there is still time to get in early.
See our latest analysis for LiveRamp Holdings
What Does LiveRamp Holdings' Recent Performance Look Like?
Recent times haven't been great for LiveRamp Holdings as its revenue has been rising slower than most other companies. The P/S ratio is probably low because investors think this lacklustre revenue performance isn't going to get any better. If you still like the company, you'd be hoping revenue doesn't get any worse and that you could pick up some stock while it's out of favour.
Keen to find out how analysts think LiveRamp Holdings' future stacks up against the industry? In that case, our free report is a great place to start.Do Revenue Forecasts Match The Low P/S Ratio?
In order to justify its P/S ratio, LiveRamp Holdings would need to produce sluggish growth that's trailing the industry.
If we review the last year of revenue growth, the company posted a worthy increase of 13%. This was backed up an excellent period prior to see revenue up by 41% in total over the last three years. Therefore, it's fair to say the revenue growth recently has been superb for the company.
Looking ahead now, revenue is anticipated to climb by 8.4% each year during the coming three years according to the seven analysts following the company. With the industry predicted to deliver 16% growth per year, the company is positioned for a weaker revenue result.
With this information, we can see why LiveRamp Holdings is trading at a P/S lower than the industry. Apparently many shareholders weren't comfortable holding on while the company is potentially eyeing a less prosperous future.
What We Can Learn From LiveRamp Holdings' P/S?
Generally, our preference is to limit the use of the price-to-sales ratio to establishing what the market thinks about the overall health of a company.
We've established that LiveRamp Holdings maintains its low P/S on the weakness of its forecast growth being lower than the wider industry, as expected. Right now shareholders are accepting the low P/S as they concede future revenue probably won't provide any pleasant surprises. It's hard to see the share price rising strongly in the near future under these circumstances.
Having said that, be aware LiveRamp Holdings is showing 1 warning sign in our investment analysis, you should know about.
If you're unsure about the strength of LiveRamp Holdings' business, why not explore our interactive list of stocks with solid business fundamentals for some other companies you may have missed.
New: AI Stock Screener & Alerts
Our new AI Stock Screener scans the market every day to uncover opportunities.
• Dividend Powerhouses (3%+ Yield)• Undervalued Small Caps with Insider Buying• High growth Tech and AI CompaniesOr build your own from over 50 metrics.
Explore Now for FreeHave feedback on this article? Concerned about the content? Get in touch with us directly. Alternatively, email editorial-team (at) simplywallst.com.This article by Simply Wall St is general in nature. We provide commentary based on historical data and analyst forecasts only using an unbiased methodology and our articles are not intended to be financial advice. It does not constitute a recommendation to buy or sell any stock, and does not take account of your objectives, or your financial situation. We aim to bring you long-term focused analysis driven by fundamental data. Note that our analysis may not factor in the latest price-sensitive company announcements or qualitative material. Simply Wall St has no position in any stocks mentioned.
Disclaimer: Investing carries risk. This is not financial advice. The above content should not be regarded as an offer, recommendation, or solicitation on acquiring or disposing of any financial products, any associated discussions, comments, or posts by author or other users should not be considered as such either. It is solely for general information purpose only, which does not consider your own investment objectives, financial situations or needs. TTM assumes no responsibility or warranty for the accuracy and completeness of the information, investors should do their own research and may seek professional advice before investing.
Most Discussed
- 1
- 2
- 3
- 4
- 5
- 6
- 7
- 8
- 9
- 10