China Tobacco International (HK)'s (HKG:6055) three-year earnings growth trails the splendid shareholder returns
The most you can lose on any stock (assuming you don't use leverage) is 100% of your money. But when you pick a company that is really flourishing, you can make more than 100%. To wit, the China Tobacco International (HK) Company Limited (HKG:6055) share price has flown 171% in the last three years. How nice for those who held the stock! On top of that, the share price is up 42% in about a quarter. But this could be related to the strong market, which is up 19% in the last three months.
Since the stock has added HK$934m to its market cap in the past week alone, let's see if underlying performance has been driving long-term returns.
This technology could replace computers: discover the 20 stocks are working to make quantum computing a reality.
To paraphrase Benjamin Graham: Over the short term the market is a voting machine, but over the long term it's a weighing machine. One flawed but reasonable way to assess how sentiment around a company has changed is to compare the earnings per share (EPS) with the share price.
During three years of share price growth, China Tobacco International (HK) achieved compound earnings per share growth of 6.7% per year. This EPS growth is lower than the 39% average annual increase in the share price. This suggests that, as the business progressed over the last few years, it gained the confidence of market participants. It's not unusual to see the market 're-rate' a stock, after a few years of growth.
The image below shows how EPS has tracked over time (if you click on the image you can see greater detail).
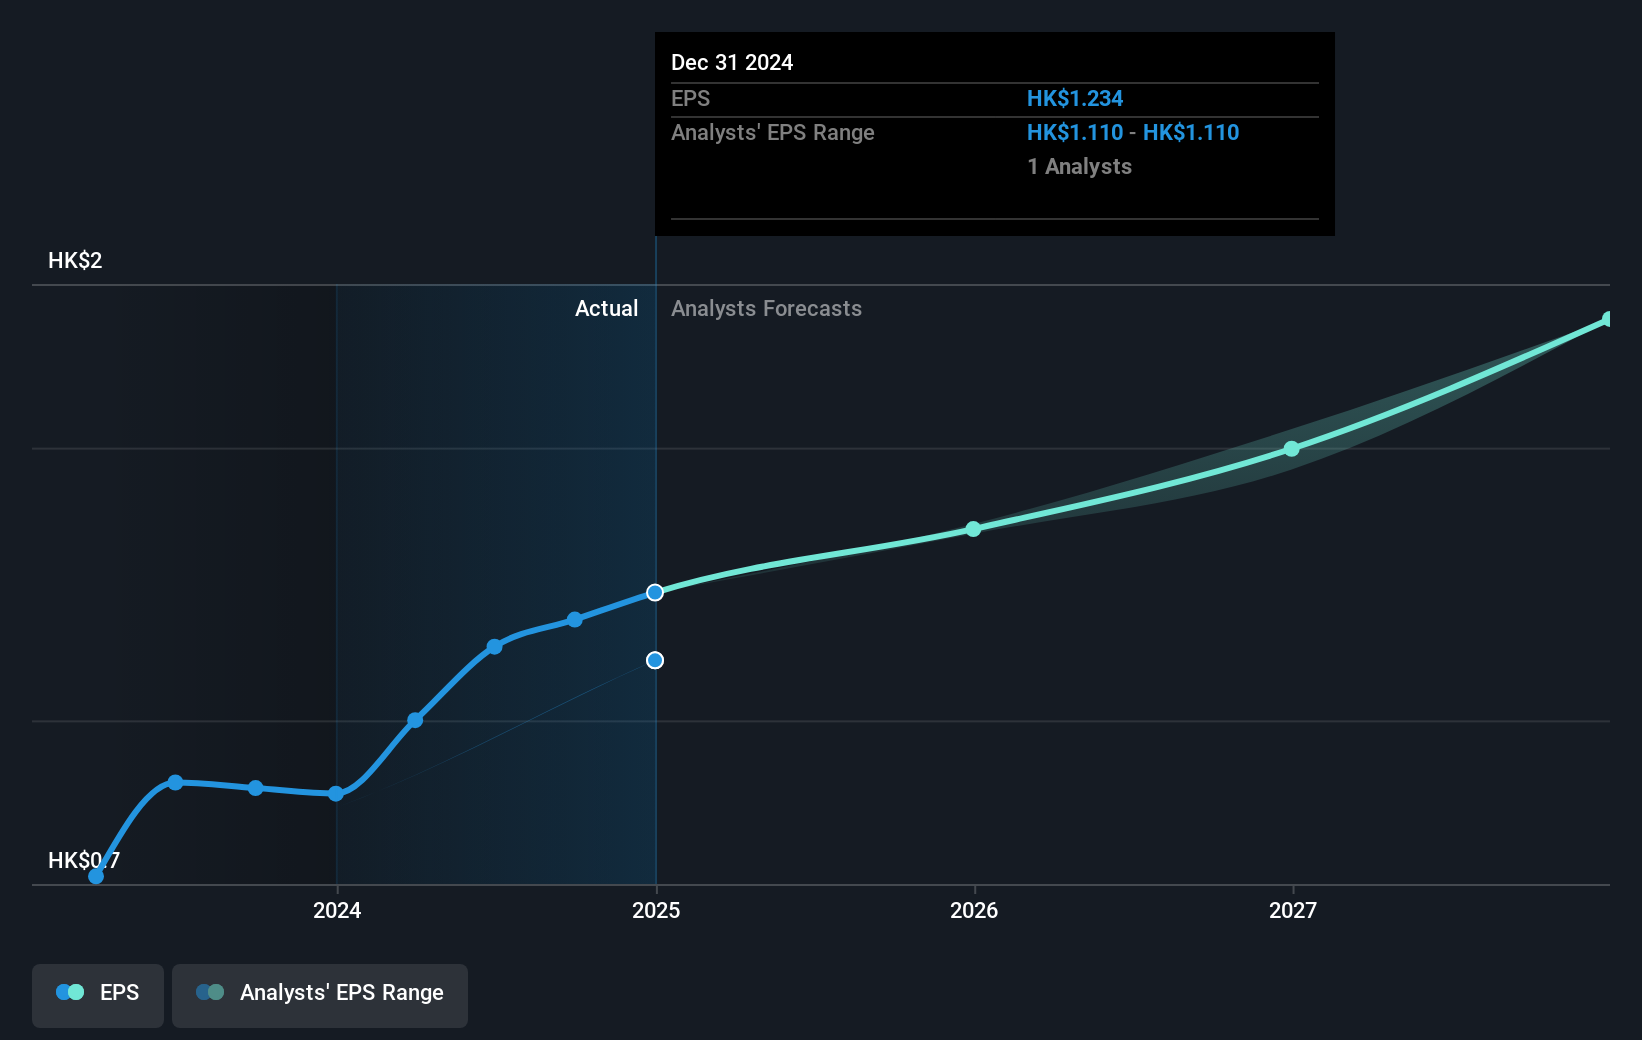
We know that China Tobacco International (HK) has improved its bottom line lately, but is it going to grow revenue? You could check out this free report showing analyst revenue forecasts.
What About Dividends?
When looking at investment returns, it is important to consider the difference between total shareholder return (TSR) and share price return. The TSR incorporates the value of any spin-offs or discounted capital raisings, along with any dividends, based on the assumption that the dividends are reinvested. So for companies that pay a generous dividend, the TSR is often a lot higher than the share price return. As it happens, China Tobacco International (HK)'s TSR for the last 3 years was 188%, which exceeds the share price return mentioned earlier. The dividends paid by the company have thusly boosted the total shareholder return.
A Different Perspective
It's good to see that China Tobacco International (HK) has rewarded shareholders with a total shareholder return of 116% in the last twelve months. And that does include the dividend. That gain is better than the annual TSR over five years, which is 17%. Therefore it seems like sentiment around the company has been positive lately. Given the share price momentum remains strong, it might be worth taking a closer look at the stock, lest you miss an opportunity. I find it very interesting to look at share price over the long term as a proxy for business performance. But to truly gain insight, we need to consider other information, too. Consider risks, for instance. Every company has them, and we've spotted 1 warning sign for China Tobacco International (HK) you should know about.
We will like China Tobacco International (HK) better if we see some big insider buys. While we wait, check out this free list of undervalued stocks (mostly small caps) with considerable, recent, insider buying.
Please note, the market returns quoted in this article reflect the market weighted average returns of stocks that currently trade on Hong Kong exchanges.
New: AI Stock Screener & Alerts
Our new AI Stock Screener scans the market every day to uncover opportunities.
• Dividend Powerhouses (3%+ Yield)• Undervalued Small Caps with Insider Buying• High growth Tech and AI CompaniesOr build your own from over 50 metrics.
Explore Now for FreeHave feedback on this article? Concerned about the content? Get in touch with us directly. Alternatively, email editorial-team (at) simplywallst.com.This article by Simply Wall St is general in nature. We provide commentary based on historical data and analyst forecasts only using an unbiased methodology and our articles are not intended to be financial advice. It does not constitute a recommendation to buy or sell any stock, and does not take account of your objectives, or your financial situation. We aim to bring you long-term focused analysis driven by fundamental data. Note that our analysis may not factor in the latest price-sensitive company announcements or qualitative material. Simply Wall St has no position in any stocks mentioned.
Disclaimer: Investing carries risk. This is not financial advice. The above content should not be regarded as an offer, recommendation, or solicitation on acquiring or disposing of any financial products, any associated discussions, comments, or posts by author or other users should not be considered as such either. It is solely for general information purpose only, which does not consider your own investment objectives, financial situations or needs. TTM assumes no responsibility or warranty for the accuracy and completeness of the information, investors should do their own research and may seek professional advice before investing.
Most Discussed
- 1
- 2
- 3
- 4
- 5
- 6
- 7
- 8
- 9
- 10