A Piece Of The Puzzle Missing From Minth Group Limited's (HKG:425) 30% Share Price Climb
Minth Group Limited (HKG:425) shares have continued their recent momentum with a 30% gain in the last month alone. The annual gain comes to 104% following the latest surge, making investors sit up and take notice.
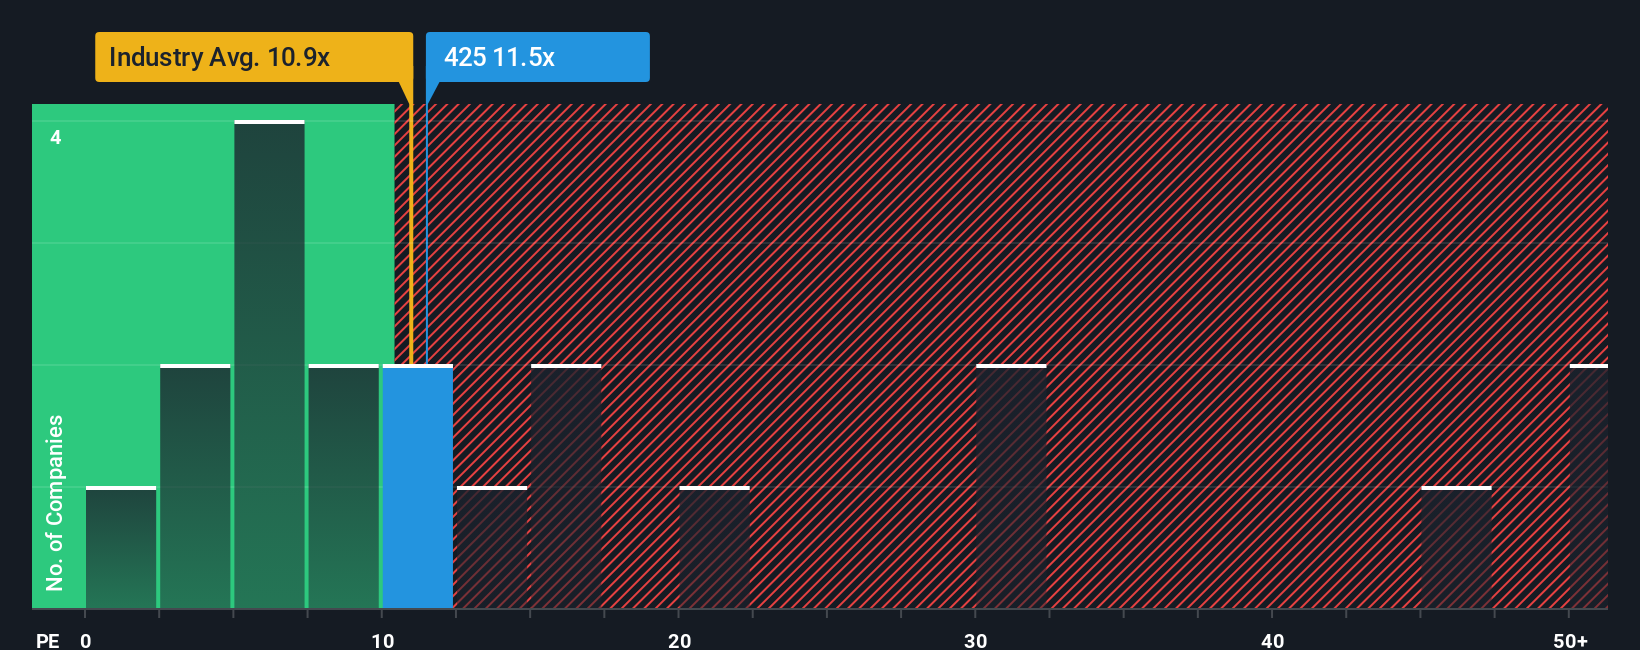
In spite of the firm bounce in price, there still wouldn't be many who think Minth Group's price-to-earnings (or "P/E") ratio of 11.5x is worth a mention when the median P/E in Hong Kong is similar at about 12x. While this might not raise any eyebrows, if the P/E ratio is not justified investors could be missing out on a potential opportunity or ignoring looming disappointment.
AI is about to change healthcare. These 20 stocks are working on everything from early diagnostics to drug discovery. The best part - they are all under $10bn in marketcap - there is still time to get in early.
Recent times have been advantageous for Minth Group as its earnings have been rising faster than most other companies. It might be that many expect the strong earnings performance to wane, which has kept the P/E from rising. If you like the company, you'd be hoping this isn't the case so that you could potentially pick up some stock while it's not quite in favour.
View our latest analysis for Minth Group
What Are Growth Metrics Telling Us About The P/E?
The only time you'd be comfortable seeing a P/E like Minth Group's is when the company's growth is tracking the market closely.
If we review the last year of earnings growth, the company posted a terrific increase of 22%. Pleasingly, EPS has also lifted 55% in aggregate from three years ago, thanks to the last 12 months of growth. Accordingly, shareholders would have probably welcomed those medium-term rates of earnings growth.
Shifting to the future, estimates from the analysts covering the company suggest earnings should grow by 19% per annum over the next three years. With the market only predicted to deliver 15% each year, the company is positioned for a stronger earnings result.
In light of this, it's curious that Minth Group's P/E sits in line with the majority of other companies. It may be that most investors aren't convinced the company can achieve future growth expectations.
The Key Takeaway
Its shares have lifted substantially and now Minth Group's P/E is also back up to the market median. While the price-to-earnings ratio shouldn't be the defining factor in whether you buy a stock or not, it's quite a capable barometer of earnings expectations.
We've established that Minth Group currently trades on a lower than expected P/E since its forecast growth is higher than the wider market. There could be some unobserved threats to earnings preventing the P/E ratio from matching the positive outlook. It appears some are indeed anticipating earnings instability, because these conditions should normally provide a boost to the share price.
Many other vital risk factors can be found on the company's balance sheet. Our free balance sheet analysis for Minth Group with six simple checks will allow you to discover any risks that could be an issue.
Of course, you might also be able to find a better stock than Minth Group. So you may wish to see this free collection of other companies that have reasonable P/E ratios and have grown earnings strongly.
New: Manage All Your Stock Portfolios in One Place
We've created the ultimate portfolio companion for stock investors, and it's free.
• Connect an unlimited number of Portfolios and see your total in one currency• Be alerted to new Warning Signs or Risks via email or mobile• Track the Fair Value of your stocks
Try a Demo Portfolio for FreeHave feedback on this article? Concerned about the content? Get in touch with us directly. Alternatively, email editorial-team (at) simplywallst.com.This article by Simply Wall St is general in nature. We provide commentary based on historical data and analyst forecasts only using an unbiased methodology and our articles are not intended to be financial advice. It does not constitute a recommendation to buy or sell any stock, and does not take account of your objectives, or your financial situation. We aim to bring you long-term focused analysis driven by fundamental data. Note that our analysis may not factor in the latest price-sensitive company announcements or qualitative material. Simply Wall St has no position in any stocks mentioned.
Disclaimer: Investing carries risk. This is not financial advice. The above content should not be regarded as an offer, recommendation, or solicitation on acquiring or disposing of any financial products, any associated discussions, comments, or posts by author or other users should not be considered as such either. It is solely for general information purpose only, which does not consider your own investment objectives, financial situations or needs. TTM assumes no responsibility or warranty for the accuracy and completeness of the information, investors should do their own research and may seek professional advice before investing.
Most Discussed
- 1
- 2
- 3
- 4
- 5
- 6
- 7
- 8
- 9
- 10