Newmont Corporation's (NYSE:NEM) Stock Is Going Strong: Have Financials A Role To Play?
Newmont (NYSE:NEM) has had a great run on the share market with its stock up by a significant 11% over the last three months. As most would know, fundamentals are what usually guide market price movements over the long-term, so we decided to look at the company's key financial indicators today to determine if they have any role to play in the recent price movement. In this article, we decided to focus on Newmont's ROE.
Return on equity or ROE is a key measure used to assess how efficiently a company's management is utilizing the company's capital. Simply put, it is used to assess the profitability of a company in relation to its equity capital.
We've found 21 US stocks that are forecast to pay a dividend yield of over 6% next year. See the full list for free.
How To Calculate Return On Equity?
ROE can be calculated by using the formula:
Return on Equity = Net Profit (from continuing operations) ÷ Shareholders' Equity
So, based on the above formula, the ROE for Newmont is:
16% = US$5.0b ÷ US$31b (Based on the trailing twelve months to March 2025).
The 'return' is the amount earned after tax over the last twelve months. That means that for every $1 worth of shareholders' equity, the company generated $0.16 in profit.
Check out our latest analysis for Newmont
Why Is ROE Important For Earnings Growth?
We have already established that ROE serves as an efficient profit-generating gauge for a company's future earnings. We now need to evaluate how much profit the company reinvests or "retains" for future growth which then gives us an idea about the growth potential of the company. Generally speaking, other things being equal, firms with a high return on equity and profit retention, have a higher growth rate than firms that don’t share these attributes.
A Side By Side comparison of Newmont's Earnings Growth And 16% ROE
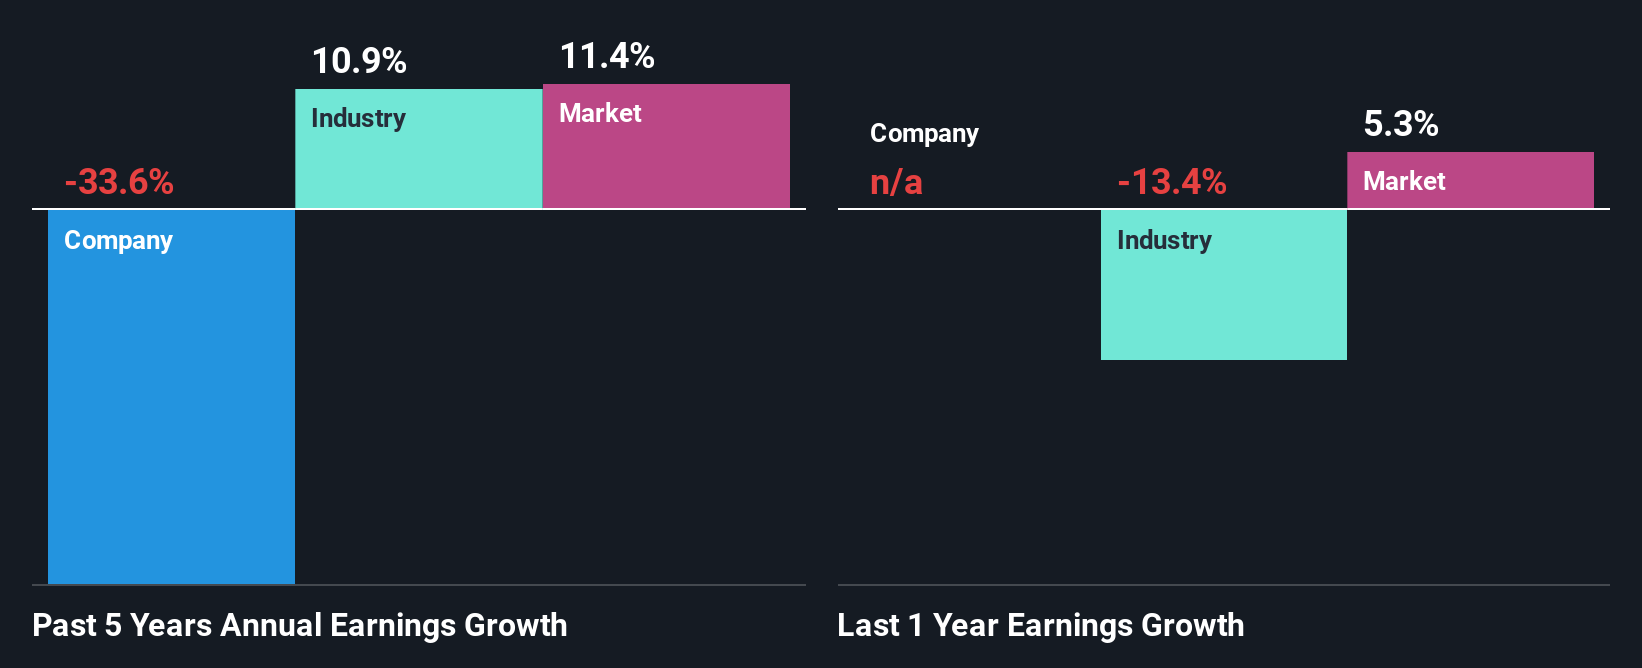
To start with, Newmont's ROE looks acceptable. Further, the company's ROE compares quite favorably to the industry average of 12%. For this reason, Newmont's five year net income decline of 34% raises the question as to why the high ROE didn't translate into earnings growth. Based on this, we feel that there might be other reasons which haven't been discussed so far in this article that could be hampering the company's growth. For example, it could be that the company has a high payout ratio or the business has allocated capital poorly, for instance.
However, when we compared Newmont's growth with the industry we found that while the company's earnings have been shrinking, the industry has seen an earnings growth of 11% in the same period. This is quite worrisome.
The basis for attaching value to a company is, to a great extent, tied to its earnings growth. It’s important for an investor to know whether the market has priced in the company's expected earnings growth (or decline). By doing so, they will have an idea if the stock is headed into clear blue waters or if swampy waters await. What is NEM worth today? The intrinsic value infographic in our free research report helps visualize whether NEM is currently mispriced by the market.
Is Newmont Making Efficient Use Of Its Profits?
Newmont's low LTM (or last twelve month) payout ratio of 23% (or a retention ratio of 77%) over the last three years should mean that the company is retaining most of its earnings to fuel its growth but the company's earnings have actually shrunk. This typically shouldn't be the case when a company is retaining most of its earnings. It looks like there might be some other reasons to explain the lack in that respect. For example, the business could be in decline.
Moreover, Newmont has been paying dividends for at least ten years or more suggesting that management must have perceived that the shareholders prefer dividends over earnings growth. Our latest analyst data shows that the future payout ratio of the company over the next three years is expected to be approximately 21%. Accordingly, forecasts suggest that Newmont's future ROE will be 14% which is again, similar to the current ROE.
Summary
On the whole, we do feel that Newmont has some positive attributes. Yet, the low earnings growth is a bit concerning, especially given that the company has a high rate of return and is reinvesting ma huge portion of its profits. By the looks of it, there could be some other factors, not necessarily in control of the business, that's preventing growth. Having said that, looking at current analyst estimates, we found that the company's earnings growth rate is expected to see a huge improvement. To know more about the latest analysts predictions for the company, check out this visualization of analyst forecasts for the company.
Valuation is complex, but we're here to simplify it.
Discover if Newmont might be undervalued or overvalued with our detailed analysis, featuring fair value estimates, potential risks, dividends, insider trades, and its financial condition.
Access Free AnalysisHave feedback on this article? Concerned about the content? Get in touch with us directly. Alternatively, email editorial-team (at) simplywallst.com.This article by Simply Wall St is general in nature. We provide commentary based on historical data and analyst forecasts only using an unbiased methodology and our articles are not intended to be financial advice. It does not constitute a recommendation to buy or sell any stock, and does not take account of your objectives, or your financial situation. We aim to bring you long-term focused analysis driven by fundamental data. Note that our analysis may not factor in the latest price-sensitive company announcements or qualitative material. Simply Wall St has no position in any stocks mentioned.
Disclaimer: Investing carries risk. This is not financial advice. The above content should not be regarded as an offer, recommendation, or solicitation on acquiring or disposing of any financial products, any associated discussions, comments, or posts by author or other users should not be considered as such either. It is solely for general information purpose only, which does not consider your own investment objectives, financial situations or needs. TTM assumes no responsibility or warranty for the accuracy and completeness of the information, investors should do their own research and may seek professional advice before investing.
Most Discussed
- 1
- 2
- 3
- 4
- 5
- 6
- 7
- 8
- 9
- 10